REIT with growth potential and stable dividends

In the heart of Southern California, where rapid e-commerce growth and high population density meet, lies an interesting dividend company. This company, which specializes in the acquisition and management of industrial properties, has built a strong position in a market where competition is high but opportunities are even greater.
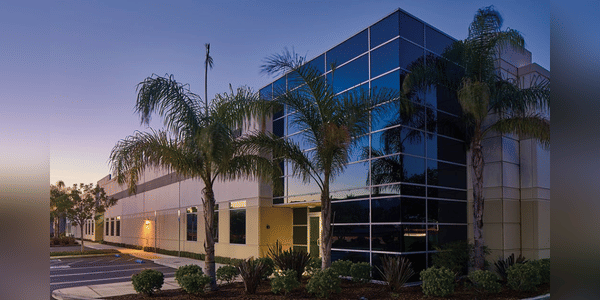
With a portfolio of over 420 properties and a market capitalization of around $11 billion, this company is growing steadily. It offers a dividend yield of 3.3%, which is attractive to investors, especially when you look at its long history of regular dividend increases. Despite current challenges, such as a slight increase in vacancy, it has been able to maintain high occupancy and significantly increase rents. Moreover, it has recently outlined a plan for how it intends to continue to grow.

Company introduction

Rexford Industrial Realty, Inc. $REXR is a Los Angeles-based company that specializes in the acquisition, ownership and management of industrial properties in the Southern California area. The firm focuses on one of the largest and most dynamic industrial markets in the U.S., making it a key player in this segment.

Founded in 2001, the company has since focused on the acquisition and development of industrial properties, including warehouse and distribution centers, primarily located in the Los Angeles metropolitan area, in the Inland Empire. This strategy has made Rexford Industrial one of the most significant owners and operators of industrial properties in Southern California.

Rexford Industrial differentiates itself from its competitors through its ability to identify and capitalize on opportunities in the industrial real estate market, both through direct acquisitions and through the redevelopment of existing properties. This approach allows them to create value for their shareholders through increasing rents and optimizing the use of their assets.

One of the key factors in Rexford Industrial's success is their in-depth knowledge of the local market and their ability to respond quickly to changes in demand for industrial space. The California market, particularly in the Los Angeles area, is characterized by high population density and strong e-commerce growth, which increases the demand for warehouse and logistics centers. Rexford Industrial is making the most of this situation and is continually expanding its portfolio, which to date numbers hundreds of properties.

It currently has more than 420 properties in its portfolio, comprising around 720 buildings, and serves approximately 1,600 tenants. With a market capitalization of approximately $11 billion, it is one of the larger players in the industrial REITs segment.

According to many analysts, Rexford Industrial is an attractive investment opportunity for those seeking stable dividend income and long-term growth potential. The company currently offers a dividend yield of 3.3%, which is more than double the average yield of the S&P 500 index. Over the past decade, Rexford has regularly increased its dividend by more than 10% annually, an impressive performance for any real estate investment trust (Despite strong operating results, however, the company's stock remains 35% below its 2022 high, which may present an interesting buying opportunity.

One of Rexford's main differentiators from other industrial REITs is its geographic concentration in Southern California. This region is not only the largest industrial market in the United States, but if it were a standalone economy, it would become the fourth largest industrial market in the world. Southern California also boasts the lowest industrial vacancy rate in the entire country, making it an extremely attractive area to operate in.

Although vacancy rates have been increasing recently, they have more than doubled in Southern California to nearly 4% since their low in 2023, Despite these challenges, Rexford has managed to maintain a high occupancy rate for its portfolio at 96.9% (Q2). Additionally, the company saw impressive rent growth of 67% for leases that renewed in Q2, showing that demand for their properties remains strong.

This performance led to FFO per share growth of 11% year-over-year in the second quarter. This growth is likely to continue as Rexford not only has plans to upgrade its properties, which will allow it to charge higher rents, but has also included rent increases in its existing leases.

Dividend

Rexford currently pays a quarterly dividend of $0.4175 per share, which equates to an annual dividend of $1.67 per share and gives its stock a yield of approximately 3.3% at the time of this writing.

In addition to its high yield, Rexford is a star performer in the dividend growth space. It has increased its annual dividend payout for 10 consecutive years, and its February 10% increase has put it on track to make 2024 the 11th consecutive year of increases.

The basis for Rexford's growth

Rexford believes it can add $240 million or more to its net operating income (NOI) by 2026. That would represent a whopping 42% increase over the fourth-quarter 2023 NOI rate.

For example, management expects to benefit $95 million from the redevelopment of existing properties. This is essentially taking older assets and upgrading them so that the REIT can charge higher rents. Another approximately $95 million is expected to come from existing leases that will convert to higher rents once the old leases expire. This isn't some fanciful forecast - in the fourth quarter of 2023, Rexford was able to sign new leases at 77% higher rents than the expiring leases.

Those will be the two biggest drivers of NOI growth over the next three years, but they're not the only ones. Another $40 million will come from rent increases written into existing leases. And $10 million will come from recent acquisitions.

This is a bit of a wild card, though, as Rexford is always looking for acquisition opportunities. The $10 million is related to what it has already bought, and if the REIT buys more properties, there could be substantial growth.

However, the big story here is not the opportunity presented by future acquisitions. Those cannot be predicted. The really attractive part of Rexford's investment thesis is that everything needed to support the NOI growth opportunity highlighted here is already in the portfolio and waiting to be tapped.

How was the company's last quarter?

The company had net income of $79.8 million, or $0.37 per diluted share, compared to $51.6 million, or $0.26 per share, in the prior year. Core FFO (funds from operations) increased to $129.6 million, up 19.5% from the prior year, with $0.60 per share, an increase of 11.1%. Portfolio net operating income (NOI) was $181.1 million, an increase of 20.9% year over year. Rental rates increased 67.7% on a GAAP basis and 49.0% on a cash basis.

The firm's average portfolio occupancy was 96.9%. In the second quarter of 2024, the firm completed three acquisitions totaling $169.5 million and sold four properties for $37 million. By mid-2024, the firm's investments include a total of $1.3 billion. The company also began leasing and stabilizing projects valued at $54.3 million.

At the end of the second quarter, the company had $125.7 million in cash on hand and $995 million on its revolving credit facility. The company's total debt was $3.4 billion with an average interest rate of 3.8%. The board also approved a dividend payment of $0.4175 per share for the third quarter of 2024.

The company updated its 2024 outlook, expecting Core FFO to increase to $2.32 - $2.34 per share and portfolio NOI to grow between 4.25% - 5.25%. These results point to strong company performance and continued growth in attractive investment opportunities in Southern California.

Key Metrics

ROE and ROA: Rexford Industrial achieves an ROE (return on equity) of 3.50% and ROA (return on assets) of 1.82%, both metrics are higher than the sector average indicating lower returns. These higher numbers suggest that the firm is more efficient in generating returns on equity and assets compared to the average REIT.

Debt-to-Equity Ratio: Rexford Industrial's debt-to-equity (Debt/Equity) ratio is 0.40, which is lower than the sector average, indicating an increasing trend. The lower ratio indicates that Rexford Industrial has a lower level of debt compared to the sector average.

Current Ratio and Quick Ratio: The company's current ratio (short-term liquidity) is 1.39, which is above the sector average of 0.89. A higher current ratio indicates that Rexford Industrial has a better ability to cover its short-term liabilities. Quick ratio (liquidity ratio) is 0.98, which is also better than the sector average.

Net Margin: Rexford Industrial Realty's net margin exceeds industry standards and is more than 30 %.

The company's performance in recent years

Total Revenue: Total revenue increased from $330,135 thousand in 2020 to $452,238 thousand in 2021. It reached $631,204 thousand in 2022 and increased to $797,826 thousand in 2023. This steady growth in revenue is indicative of the company's successful business strategies and expansion.

Gross ProfitA: Gross profit increased from $250,419 thousand in 2020 to $344,517 thousand in 2021. It reached $480,701 thousand in 2022 and increased to $613,347 thousand in 2023. This increase in gross profit indicates improved efficiency and better cost management.

Operating ExpenseA: Operating Expense increased from $152,064 thousand in 2020 to $200,259 thousand in 2021. It was $261,058 thousand in 2022 and increased to $319,537 thousand in 2023. This increase is a reflection of the company's expansion and increased activity, but even so, profits have increased significantly.

Operating IncomeA: Operating Income increased from $98,355 thousand in 2020 to $144,258 thousand in 2021. It was $219,643 thousand in 2022 and increased to $293,810 thousand in 2023. This growth indicates an improvement in operational efficiency and profitability.

Interest Expense (Net Non Operating Interest Income Expense): Net interest expense increased from -$30,849 thousand in 2020 to -$40,139 thousand in 2021. In 2022 it was -$48,496 thousand and increased to -$61,400 thousand in 2023. This increase reflects rising interest expense, but was offset by higher revenues.

Net Income Common Stockholders: Net income for common shareholders increased from $61,349 thousand in 2020 to $111,761 thousand in 2021. In 2022 it was $157,481 thousand and in 2023 it reached $227,449 thousand. This significant increase in net income is indicative of effective cost management and successful business operations.

Earnings per share (EPS)A: Earnings per share increased from $0.51 in 2020 to $0.80 in 2021. It was $0.92 in 2022 and increased to $1.12 in 2023. This increase in EPS indicates growing shareholder value and improved profitability for the company.

EBITDA: EBITDA increased from $227,013 thousand in 2020 to $327,654 thousand in 2021. In 2022 it was $422,447 thousand and in 2023 it reached $555,501 thousand. This increase indicates that the company is effectively generating cash from its core business.

⚠ Invest responsibly!

The information in this article is for educational purposes only and does not serve as an investment recommendation. The authors present only facts known to them and do not draw any conclusions or make any recommendations to the reader.

Investing can be risky if you approach it recklessly. Bulios does not know your financial situation and therefore does not give specific advice and tips in any way. Stock selection, strategy and portfolio construction is an individual matter, so always educate yourself and perform your own detailed analysis before buying a particular stock.

Přečíst celý článek? Staň se členem Bulios Black

Vybírej akcie jako profíci s analýzami a nástroji Bulios Black
21.99 USD měsíčně
(lze kdykoliv zrušit)
Usnadni si výběr akcií díky důkladným analýzám top firem
Sleduj výkonnost svého portfolia a dividendy v portfolio trackeru
Získej přehled férových cen akcií 500 nejoblíbenějších firem
Aktuální informace a souhrny výsledků ke tvým firmám
Předplatit členství
Don't have an account? Join us

Log in to Bulios


Or use email and password
Už jsi členem? Přihlásit se

Create Bulios profile

Continue with

Or use email and password
You can use lowercase letters, numbers, and underscores

Why Bulios?

One of the fastest growing investor communities in Europe

Comprehensive data and information on thousands of stocks from around the world

Current information from global markets and individual companies

sign.popup.registration.listWhy.fourth

Fair prices, portfolio tracker, stock screener and other tools

Timeline Tracker Overview