


5 companies that squeeze unusually high cash from every dollar of revenue

Five companies from five different industries, from design software to pharmaceuticals, convert 23 to 42 cents of every dollar of revenue into free cash flow. For some, this ability comes from their business structure, for others from a single product, a regulatory privilege, or acquisition discipline. This difference determines how durable their cash is and explains why the shares of all five lost 27 to 62% over the past year.
Key points
Operating cash flow for all five companies reaches 32 to 42% of revenue.
Differences in FCF margin arise almost entirely from capital expenditures.
Sector explains only part of the result; business model is decisive.
The most valuable thing is sustainable pricing power and high return on capital.
Management decides mainly how the generated cash is used.
The income statement captures how much a company earned according to accounting rules. The cash flow statement captures how much money actually remained. For most companies, the two figures don't differ much, but for some they diverge so much that accounting profit tells only part of the story about the real economics of the business. For a long-term shareholder, cash is what matters, because it funds dividends, buybacks, and acquisitions, and it cannot be improved by choosing an accounting method. But the level of cash margin alone is not enough. The same number can result from a durable competitive advantage or from one exceptionally good year, from a strong market position or from deferred investments. What is decisive, therefore, is where the cash comes from and how long it can be expected at a similar level.
From revenue to cash: five levels of profitability
The claim that a company "squeezes a lot of cash from every dollar of revenue" means a high ratio of free cash flow (FCF) to revenue. The path to this number passes through several levels, each filtering out a different group of costs:
Gross margin shows how much remains from revenue after deducting direct costs of producing or delivering the product. For software this is often over 90%, for a manufacturing company often 20 to 40%.
Operating margin (EBIT margin) additionally deducts research and development, sales, marketing, and administration including depreciation. It is the best accounting measure of the economics of the business itself.
Net margin takes into account interest, taxes, and one-time items. It can therefore easily be distorted by asset sales, goodwill write-offs, or interest income from cash.
Operating cash flow margin (OCF margin) replaces accounting profit with actual cash flows. It adds back non-cash expenses (depreciation, stock-based compensation) and reflects changes in working capital, i.e., receivables, inventories, payables, and customer advances.
Free cash flow margin (FCF margin) subtracts capital expenditures (capex) from operating cash flow, i.e., investments in buildings, machinery, land, or capitalized software. The result is cash that the company can pay out to shareholders, use for acquisitions, or repay debt.
The relationship between the levels can be simplified as follows: FCF = net income + depreciation and other non-cash expenses - increase in working capital - capital expenditures. The ratio of FCF to net income (or to after-tax EBIT) is called cash conversion. A value above 100% means the company creates more cash than it reports as profit.
Two companies with the same revenue
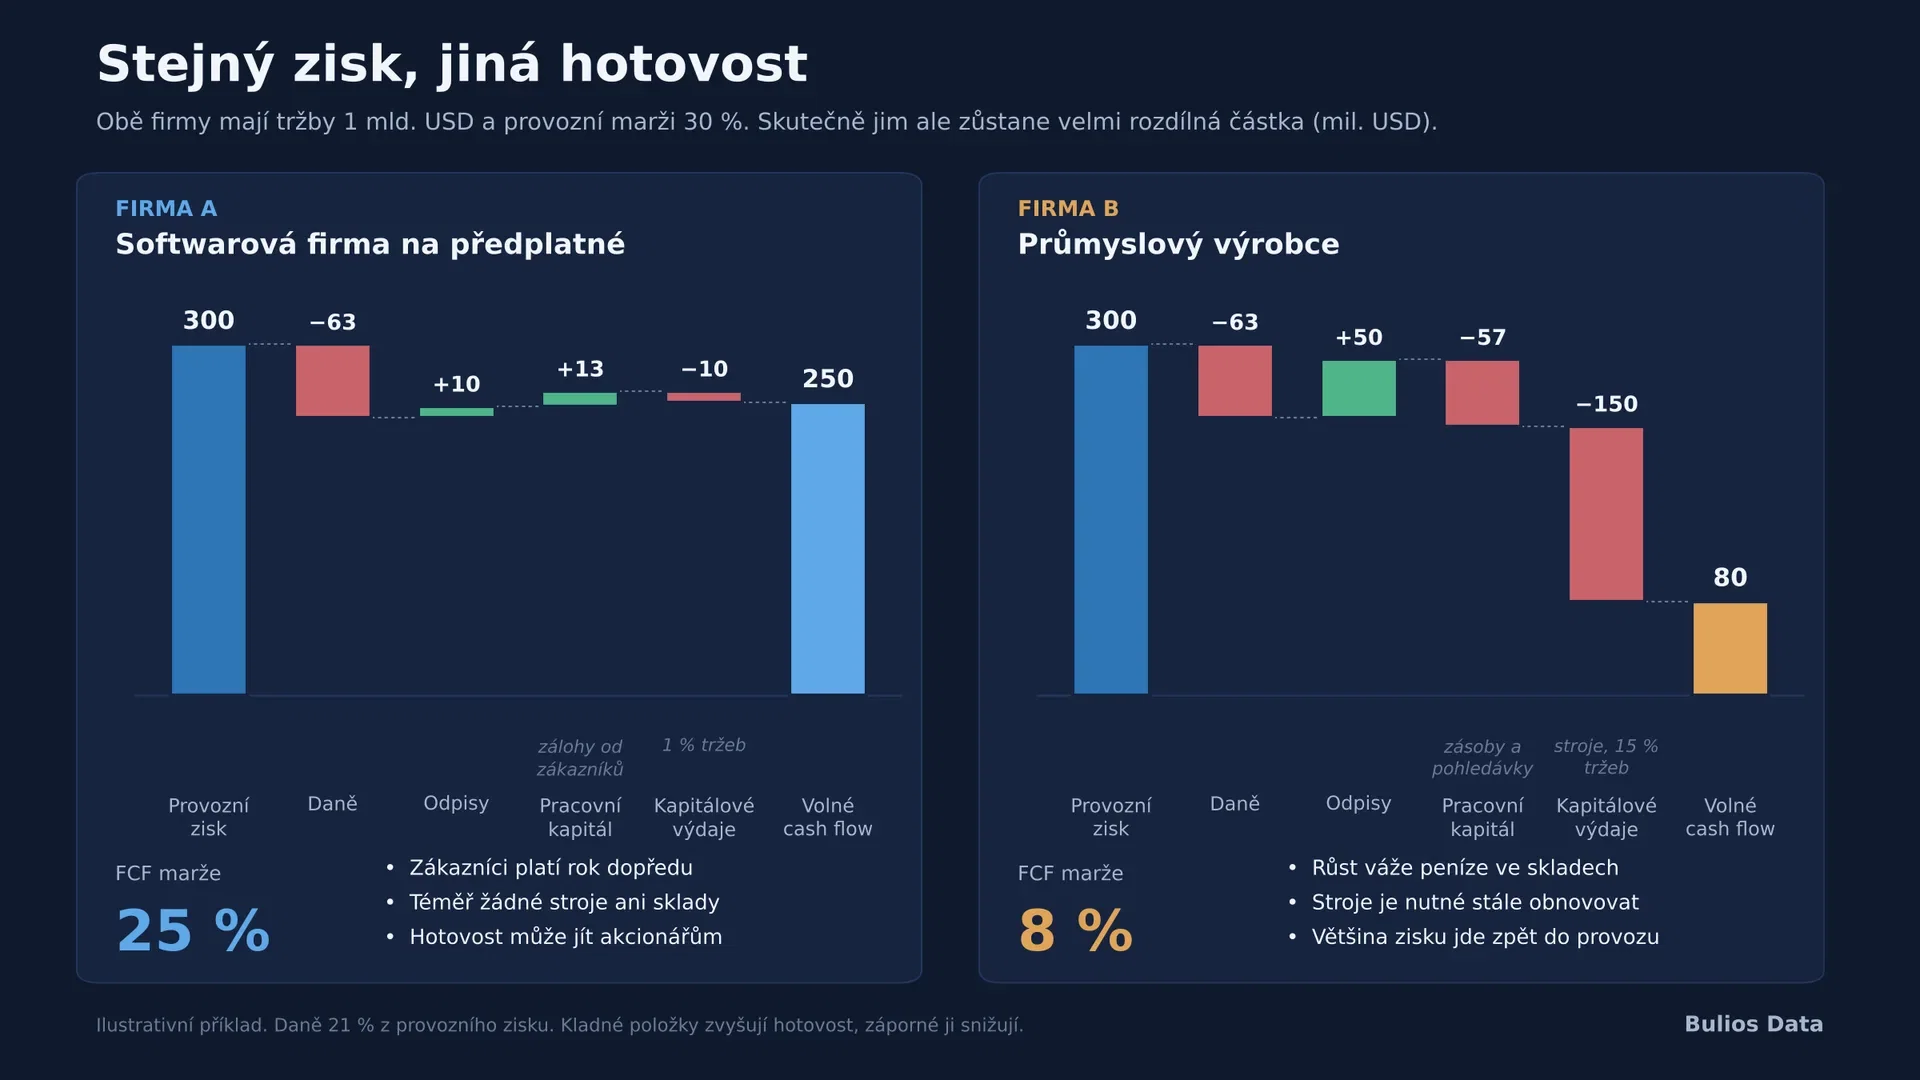
Company A and Company B both have revenue of $1 billion and both report an operating margin of 30%. Company A is a subscription software company: customers pay a year in advance, so deferred revenue accumulates on its balance sheet, depreciation is negligible, and capital expenditures are 1% of revenue. After paying taxes, it is left with FCF of $250 million. Company B is an industrial manufacturer. For every dollar of growth it must tie up money in inventories and receivables, and to maintain production it invests 15% of revenue in machinery. With the same accounting profit, it is left with FCF of $80 million.
From the income statement perspective, the two companies look identical. Economically they are different: Company A can distribute the remaining cash to shareholders or reinvest it elsewhere, while Company B must put most of its profit back into its own operations just to maintain its current size. For a long-term shareholder, therefore, what matters is not revenue growth itself, but how much cash actually remains from that growth and with what return it can be reinvested.
A higher FCF margin does not automatically mean a better company. Company B may have high capital expenditures because it is building capacity with a 25% return. Company A may have high FCF only because it pays employees with stock, which FCF does not capture at all.
Sector, business model, or management?
High cash generation can be broken down into three layers. The sector determines the starting conditions: software requires minimal physical capital, pharmaceuticals have high gross margins protected by patents, logistics and manufacturing are capital intensive. The business model decides how a company makes money within its sector: whether revenue is recurring, whether customers pay in advance, whether switching costs are high, whether a network effect exists, and whether revenue grows faster than costs. Management then influences capital allocation, pricing policy, discipline in capital expenditures, and acquisition returns.
A useful thought test is this: if an average management took over the same company, would its cash conversion remain as high? If yes, it is a structural feature of the business. If not, the investor is paying for the abilities of specific people, which may not be permanent.