Don't rejoice, experts warn. This chart shows that the market downturn is far from bottoming out
Based on the fundamentals, experts are still somewhat skeptical about the market development. Unfortunately, even technical analysis does not have good news for investors. The charts show that a bull market is still not in sight. Find out why here!
But let's start on a positive note - the stock market's long-term prospects have improved in recent months. Or at least according to the experts and their chart analysis. In fact, they rate the market's performance so far this year as average - which is a good thing. Given this year's bear market, "average" performance actually looks pretty good.
Except what does average mean? It means compared to the trend. And that trend is based on a really, really long history and a lot of data. In fact, at its October low, it stood fairly close to the top of a trend line based on the stock market's inflation-adjusted total return since 1871.
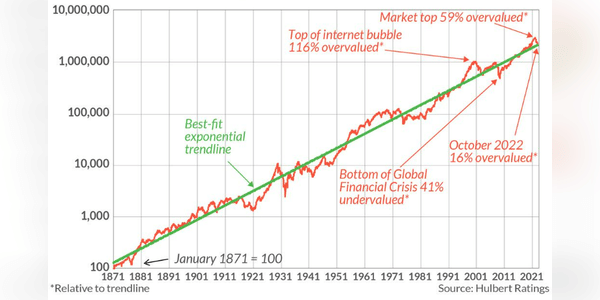
However, this does not guarantee that the stock market will not go lower. On the contrary, analysts fear it will repeat its history and fall well below the trend line. And this is especially true in the longer term.
But let's be positive. Whether the market will rise we don't know. But we do know what has happened historically in similar situations. According to data compiled by Robert Shiller, a finance professor at Yale, the stock market has delivered a total return above inflation of 6.85% per year since 1871. If the future resembles the past, it suggests that stock positions created today will eventually - over the long term - outperform inflation by a similar amount.
In the short term?
The short-term charts have been generating a flurry of debate on the networks this week, while also looking very positive. This chart appeared on social media this week. It showed how 2009, 2015 and 2016 created significant deviations from the weekly RSI of the S&P 500 index on days. The claim was that the current divergence also indicates a bottom.
In addition, the two divergences that signaled major bottoms in 2002 and 2008 occurred with the 14-week RSI below 30.
Volatility
Twenty-one day standard deviation of daily returns of the S&P 500 index is used to calculate realized volatility and the level of the VIX index is used as implied volatility.
Throughout this year's downtrend, both realized and implied volatilities have remained well below levels seen in previous bear markets. In other words, we have not witnessed any sharp increase in volatility this year. Realized volatility has remained below 33% and implied volatility is below 39%.
Volatility usually rises sharply near the bottom of bear markets. Unless "this time is different", we have not yet seen the bottom.
https://www.youtube.com/watch?v=Ogogj_cf7EM
If you enjoy my articles and posts, feel free to throw a follow. Thanks! 🔥
Disclaimer: This is in no way an investment recommendation. This is purely my summary and analysis based on data from the internet and a few other analyses. Investing in the financial markets is risky and everyone should invest based on their own decisions. I am just an amateur sharing my opinions.
fsghfsd gsdjhg
Hubo un tiempo hace años en que las únicas personas que podían comerciar activamente en el mercado de valores eran las que trabajaban para grandes instituciones financieras, casas de bolsa y casas comerciales. La llegada del comercio en línea, junto con la difusión instantánea de noticias, ha nivelado el campo de juego, o deberíamos decir comercio. Las aplicaciones comerciales fáciles de usar y el 0% de comisiones de servicios como Robinhood, TD Ameritrade y Charles Schwab han hecho que sea más fácil que nunca para los inversores minoristas intentar operar como los profesionales.
great
This Good Information, Thank's!!!
The Meta job cuts are just the latest sign of pain in the tech sector, coming after Elon Musk, Twitter Inc.’s new CEO, fired almost half of the company’s workforce.6