Global rail industry leader grows demand and dividends

The rail industry is experiencing dynamic growth and one of the leading companies in the sector is maintaining its strong position through innovation and strategic moves. The company recently secured new orders for railcars worth nearly $690 million, a testament to its ability to respond to current market needs and maintain a strong market position. In addition, the company boasts a successful expansion of its fleet, which now numbers 14,600 units at nearly 99% utilization.

Another interesting aspect is the stable and growing dividend the company pays. Currently, the dividend is USD 0.30 per share, which represents a dividend yield of 2.41%. This growth is also noticeable on a year-over-year basis, with an 8.1% increase. With consistent dividend increases and a healthy payout ratio, the company provides investors with an attractive return and stability.

Company performance
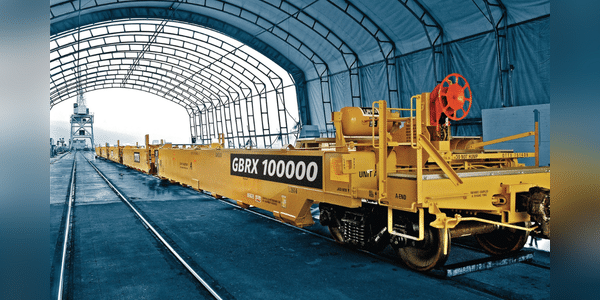
Greenbrier Companies $GBX, headquartered in Lake Oswego, Oregon, is a leading manufacturer and service provider to the railroad industry. The company focuses on manufacturing a wide range of railcars, including freight, tank and intermodal container cars. In addition to manufacturing, the company also offers comprehensive maintenance and repair services, which includes upgrading and refurbishing existing vehicles to ensure their longevity and reliability.

Greenbrier operates in international markets, including North America, Europe and South America. With manufacturing facilities in the U.S., Mexico, Poland, Romania and Brazil, it can respond effectively to the needs of different regions and maintain a high level of customer service. The company is known for its innovative technology, which includes the development of greener railcars with lower fuel consumption and reduced emissions, contributing to the sustainability of rail transport.

Since its founding in 1981, Greenbrier has steadily expanded through strategic acquisitions that have strengthened its market position and broadened its product portfolio. In the 1990s, the company began producing its own railcars, a key step in consolidating its position as an industry leader. The company's management emphasizes an open corporate culture and safety in the workplace, which is reflected in low accident rates and high employee morale.

Environmental initiatives are another key aspect of the company's strategy. Greenbrier is actively engaged in projects aimed at reducing the carbon footprint of rail transport, which includes not only producing more fuel-efficient carriages but also optimising processes throughout the supply chain. These efforts have made Greenbrier not only an economically stable company, but also a responsible partner to the communities in which it operates.

An experienced management team, led by the CEO, ensures that the company remains on the cutting edge of innovation while maintaining solid financial stability. As a result, Greenbrier Companies exemplifies the successful combination of traditional values with modern technology, cementing its position as a major player in the global rail transportation market.

Greenbrier Companies in the spotlight

Greenbrier Companies trades on the NYSE under the symbol GBX. Since the beginning of the year, the stock has shown a price increase of 10.19%. The company currently pays a dividend of $0.30 per share, which represents a dividend yield of 2.41%. Comparatively, the Transportation - Equipment and Leasing sector yields 1.75%, while the S&P 500 index yields 1.62%.

In terms of dividend growth, the company's current annual dividend of $1.20 is up 8.1% from last year. Over the past five years, Greenbrier has increased its dividend twice, representing an average annual increase of 2.84%. Future dividend growth, then, will depend on earnings growth and the payout ratio, which is the ratio of earnings per share that the company pays out as a dividend. Currently, Greenbrier's payout ratio is 31%, which means it has paid out 31% of its earnings over the past 12 months as a dividend.

For this fiscal year, Greenbrier expects strong earnings growth. According to the Zacks Consensus Estimate for 2024, the expected earnings per share is $4.23, up 42.42% from last year. This growth reflects the company's positive outlook and its ability to increase shareholder value.

Quarterly Results

The Greenbrier Companies reported its financial results for the second fiscal quarter ended February 29, 2024. The company, which is a major supplier of equipment and services to the global trucking markets, has experienced a number of successes.

During the quarter, Greenbrier grew its fleet by 500 units to a total of 14,600 units with lease fleet utilization at nearly 99%. The company received new railcar orders of 5,900 units valued at nearly $690 million and delivered 5,600 units, creating a new backlog of 29,200 units with an estimated value of $3.6 billion.

Net income attributable to Greenbrier was $33 million, or $1.03 per diluted share, on sales of $863 million. EBITDA for the quarter was $95 million, or 11% of sales. The company also successfully repaid the remaining $48 million of convertible notes due in 2024.

The Board of Directors declared a quarterly dividend of $0.30 per share, payable on May 14, 2024, representing the Company's 40th consecutive quarterly dividend. CEO Lorie L. Tekorius highlighted the company's accomplishments, which include a diverse product offering and strong market relationships that ensure Greenbrier's strong market position.

Business Outlook and Update

Based on current trends and production plans, Greenbrier updated its outlook for fiscal 2024. It expects shipments of between 23,500 and 25,000 units, including approximately 1,400 units in Brazil. Sales are expected to be in the range of $3.5 billion to $3.7 billion, with capital expenditures of approximately $140 million in manufacturing and $15 million in maintenance services. Leasing and management investments are estimated at $350 million, including the transfer of railcars to the leasing fleet. Revenue from equipment sales is expected to be approximately $75 million.

Recent results

The company has shown remarkable progress in recent years, which must be carefully analyzed to understand how it has fared through 2023.

Starting with total revenues, we see that the company has shown steady growth, albeit with some fluctuations. In 2020, sales were $1.75 billion, and in 2021 there was a significant growth to $2.98 billion, which could have been affected by external factors such as the pandemic. However, subsequent growth to $3.94 billion in 2022 and $3.73 billion in 2023 suggest continued strong growth and continued expansion.

Cost of sales followed a similar pattern, with an increase from $2.44 billion in 2020 to $3.50 billion in 2022, reflecting rising operating costs in line with growing sales. As a result, gross profit, despite fluctuations, showed growth from $231.6 million in 2020 to $498.3 million in 2023.

Operating expenses remained relatively stable, ranging from $191.8 million in 2020 to $242.8 million in 2023, indicating effective cost management. Operating profit therefore showed a decent growth from $39.8 million in 2020 to $255.5 million in 2023, a sign of improving operational efficiency.

The company's pre-tax profit fluctuated, but generally grew from -$8.6 million in 2020 to $150.2 million in 2023. The company's net income also showed an increasing trend, from $32.4 million in 2020 to $110.7 million in 2023, a very positive sign for investors. This improvement is also reflected in the growth of basic and diluted earnings per share, which increased from 0.99 to 3.53 and from 0.96 to 3.39, respectively.

The company's EBITDA increased from $136.8 million in 2020 to $343.7 million in 2023, reflecting strong growth before accounting for interest, taxes, depreciation and amortization. Normalized EBITDA followed a similar growth trend, indicating stable earnings after removing unusual items.

Key indicators

P/E ratio (Non-GAAP, TTM): The company's trailing 12-month P/E (Non-GAAP) (TTM) is 12.61, which is 33.64% lower than the sector average. This indicates that the company is undervalued compared to its peers. Compared to the company's five-year average of 14.32, this is 11.94% lower, indicating an improvement in efficiency.

PEG ratio (GAAP, TTM): PEG (Price/Earnings to Growth) ratio of the company is 0.08 as against the sector average of 0.96.

EV/Sales and EV/EBITDA: The EV/Sales (0.88) and EV/EBITDA (8.99) ratios are also lower than the sector average (1.84 and 12.76, respectively). This indicates that the company is more efficient in generating sales and earnings from its enterprise value than the sector average. Compared to the company's five-year average, these values are stable, which is a positive signal.

EV/EBIT ratio (TTM and FWD): The EV/EBIT ratios (12.77 TTM and 11.35 FWD) are significantly lower than the sector averages (17.29 and 15.48), indicating that the company is more efficient in generating operating profit from its enterprise value.

Price/Sales and Price/Book ratio: The Price/Sales (0.41 TTM and 0.43 FWD) and Price/Book (1.19 TTM and 1.18 FWD) ratios are significantly lower than the sector averages (1.47 and 1.43 for Price/Sales and 2.73 and 2.66 for Price/Book). This shows that the company's stock is undervalued in terms of both earnings and book value compared to its peers.

⚠ You will find a lot of inspiration on Bulios, but the final stock selection and portfolio construction is of course up to you, so always do a thorough analysis of your own. Practical tools within the membership Bulios Black are always at your disposal.

Přečíst celý článek? Staň se členem Bulios Black

Vybírej akcie jako profíci s analýzami a nástroji Bulios Black
21.99 USD měsíčně
(lze kdykoliv zrušit)
Usnadni si výběr akcií díky důkladným analýzám top firem
Sleduj výkonnost svého portfolia a dividendy v portfolio trackeru
Získej přehled férových cen akcií 500 nejoblíbenějších firem
Aktuální informace a souhrny výsledků ke tvým firmám
Předplatit členství
Don't have an account? Join us

Log in to Bulios


Or use email and password
Už jsi členem? Přihlásit se

Create Bulios profile

Continue with

Or use email and password
You can use lowercase letters, numbers, and underscores

Why Bulios?

One of the fastest growing investor communities in Europe

Comprehensive data and information on thousands of stocks from around the world

Current information from global markets and individual companies

sign.popup.registration.listWhy.fourth

Fair prices, portfolio tracker, stock screener and other tools

Timeline Tracker Overview