Imperial Oil Limited: the Canadian black gold miner

Recent results from Imperial Oil have beaten the market consensus. However, it has not yet been enough to reach a new peak. Does the company have what it takes to get above $75 per share and break its current price record?
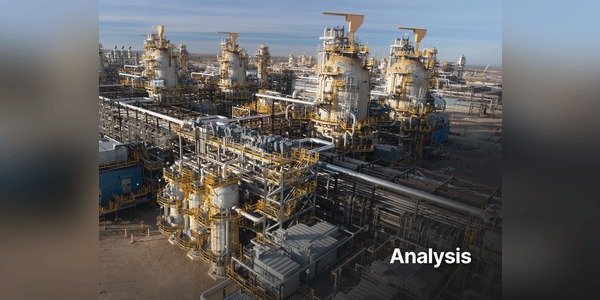
Imperial Oil Limited owns and operates several refineries, including those in Sarnia, Strathcona and Nanticoke. The company is also a major player in the oil sands, specifically the Kearl project, which is one of the largest oil sands projects of its kind in the world. In addition, Imperial Oil is engaged in the production of conventional oil and gas in various locations across Canada.

The company $IMO+2.9% is known for its Esso brand, under which it sells its products, such as fuels and lubricants, to consumers across the country. Imperial Oil Limited is a subsidiary of ExxonMobil, which owns approximately 69.6% of its shares. This affiliation with one of the world's largest oil giants allows Imperial Oil to benefit from the technological innovations and global expertise of its parent company.

Interesting fact: In 1947, the company discovered huge oil reserves in Leduc, Alberta, a pivotal moment for Canada's energy sector. This discovery led to an oil rush in Alberta and fundamentally changed the economic and industrial development of the region.

Managment

Bradley W. Cornson - CEO

Brad was appointed Chairman, President and Chief Executive Officer of Imperial Oil on January 1, 2020.

He began his career with ExxonMobil in 1983 in New Orleans, Louisiana where he held various technical, operational, sales and management positions around the world. In addition to several positions throughout the United States, he also held key leadership positions in Hong Kong and London.

In 2009, he was named Vice President of ExxonMobil Production Company with responsibility for oil and gas production in Europe and the Caspian regions. Six years later, he was named President of ExxonMobil Upstream Ventures and Vice President of ExxonMobil Corporation, where he was responsible for overseeing ExxonMobil's global upstream acquisition and divestiture programs. Under his leadership, ExxonMobil $XOM+1.2% made key strategic acquisitions in the Permian Basin, Papua New Guinea, Mozambique and Brazil.

Bradley Corson, a native of Illinois, holds a Bachelor of Science degree in Chemical Engineering from Auburn University. He currently serves on the Board of Directors of the Canadian Association of Petroleum Producers and also serves on the Executive Board of the Boy Scouts of America. He and his wife Joan have two sons.

Industry/Company Specialty

Exploration and Production: Imperial Oil is engaged in the exploration and production of conventional oil and gas reserves in various locations across Canada. This activity includes the identification and development of new discoveries, as well as the use of advanced technologies to maximize recovery and production efficiency.

Oil Sands: The Company is a leader in oil sands production, particularly through its Kearl project in Alberta. This project utilizes innovative technologies that allow for more efficient and environmentally friendly extraction. The oil sands represent a significant portion of the Company's total oil production.

Refining and Marketing: $IMO owns and operates several refineries in Canada where it processes crude oil into various petroleum products such as gasoline, diesel, aviation fuel and lubricants. The products are sold under well-known brands such as Esso, ensuring a strong presence in the retail fuel market.

Chemical manufacturing: The company is engaged in the manufacture and sale of chemical products, including petrochemicals and specialty chemicals used in various industries. This division contributes to revenue diversification and enables Imperial Oil to exploit synergies between its refining and chemical processes.

Technology Research and Innovation: Imperial Oil invests in technological research and development to improve the efficiency and sustainability of its operations. The company focuses on innovations in oil sands extraction, reducing greenhouse gas emissions and improving energy efficiency. In doing so, it seeks to minimize the environmental impact of its operations and ensure long-term sustainability.

Company profitability and cash

The company has been moving sideways for the past few months. Even the recent quarterly results, which were positive and managed to beat analysts' estimates in both earnings per share and revenue, failed to take the price per share to a new peak. Once the price moves more significantly, a new trend is likely to occur.

The company's current market capitalization, while not at its peak, is very close to it. Specifically, it is less than 6%. The company's capitalization today is $37.46 billion. There are 5,300 people working for $IMO+2.9%.

IMO
$68.87 $1.93 +2.88%
Capital Structure
Market Cap
35.9B
Enterpr. Val.
51.1B
Valuation
P/E
9.6
P/S
0.9

We've already hinted at the stock split in terms of its holdings. The company is only 30.68% owned by investors. 371 million shares, which is the rest of the company's stock, is in fact owned by $XOM+1.2%. So it clearly has the largest voting power and control over the company. Imperial Oil's debt is $3.2 billion. The cash that management now has is $1.48 billion.

In 2019, the company made a total of $24.83 billion. Net income was $1.7 billion at operating margins of 6.83%. In 2020, the company's business overall has declined. Revenue fell to $16.13 billion and margins fell to below zero. They were negative 9.04%. $IMO+2.9% made $1+2.9%.46 billion in sales that year. But its business grew very significantly in the next two years. Revenues came in at $28.13 billion in 2021. Profit margin jumped to 6.97%, bringing profits to $1.96 billion. The most successful year so far, 2022, brought the company revenue of $42.22 billion. Operating margins increased to 12.82% and net profit was $5.41 billion. Last year, revenue declined to $33.44 billion. Margins fell to 10.12% and net profit was $3.69 billion.

The company, being a sort of an extended arm of Exxon, has its business spread exclusively in Canada. 100% of its revenues come from that country. Which was $38.25 billion last year.

Most of the company's revenue comes from the sale of oil and gas on the move (mainly by pipeline). This major part of its business model earned it $37.15 billion in 2023. This is equivalent to 97.12% of the total revenue value. The company then earned $934 million from the chemical treatment of extracted products. The last 0.44% comes from mining development.

Earnings per share stood at $1.01 in 2017. This was 1.24% above market expectations. In the next two years, the company was able to increase the earnings per share value gradually. First to $2.09 and then to $2.22. However, in 2020, due to the slowdown in the economy and the overall business, EPS fell to $1.99. Market estimates at the time were 195% higher. The next few years, however, the company began to thrive. The ramp-up in 2021 was slower, but it still meant that EPS got back into positive territory. Then in 2022, earnings per share were an all-time high of $8.2. Last year, they were $6.41. Based on the current results, $IMO+2.9% should be able to hold those numbers through at least 2027, with slow growth starting in 2025.

Things weren't so bad for revenue. While their value has also not risen every time, there have not been as severe fluctuations as in earnings per share. In 2017, the value of sales was $23.48 billion. A year later, the revenue value had increased to $25.7 billion. In 2019, the company's revenue was $26.33 billion. In the covid year, their value decreased to $17.57 billion. The market counted on such a drop, and roto failed to beat estimates at that time by only 3.29%. It wasn't until 2021 that it managed to beat the market consensus for the first time since 2017. Revenues were $29.72 billion. Like EPS, 2022 was the best year. Revenue at that time was $44.02 billion. Last year, however, it fell to $38.46 billion. By 2026, the company should be at that level, but by 2027, revenue should be down.

The development of revenue from the largest $IMO+2.9%sector has been very interesting over the past few years. In 2017, revenues from it were $16.53 billion. By 2019, they have reached $18.19 billion. In 2020, when they reached their absolute peak they were at $42 billion and $390 million. The chemical segment has definitely not experienced such growth over the same time period. In 2017, it earned $885 million compared to $934 million last year.

Operating expenses

The company's costs have historically varied based on current market conditions rather than how much money the company was currently making although there are some minor similarities here as well. The oil business is dependent on the price of that particular 'black gold', which can change significantly throughout the day. In 2010, the company needed $5.5 billion for one quarter. This value slowly increased until 2014, when it reached $7.7 billion. In the next two years after that came the decline. By mid-2016, the company was spending "only" $4 billion per quarter. From then until 2020 came a neutral period that increased spending to only $6 billion. In 2020, this time due to a decline in business, their value dropped to $3.2 billion in one quarter. But from that low, spending began to rise rapidly. By 2022, when the company was doing very well its spending was rising. It had reached $11 billion. In 2023 and this year, one quarter the company is coming out similarly, at $8 billion.

Dividend

The company has been in the stock market since the 1960s. It paid its first dividend back in 1987. it was at the rate of $0.004 per share. This makes $IMO+2.9% one of the dividend kings, having paid dividends for over 37 years. However, the dividend hasn't increased much since that date. But in 1998, when the stock split at 3/1, the dividend was already $0.043. There has not yet been another split.

The company has never been forced to cut the dividend, and so it has been one of the most resilient, despite reductions in the crisis years. Currently, stockholders can look forward to a quarterly payout of $0.435 per share of $IMO.

Valuation/Comparison to peers

The company's P/E ratio stood at 15 in 2010. However, by 2015, the ratio was getting lower and lower due to ever-increasing earnings per share. It had stalled at 8.7 points. From there, it then hit its peak of 96 points in just a few months as EPS fell quickly and significantly. In 2017, the company leveled off at a P/E of 17, but the next year saw rapid growth again. This time to "only" 59 points. From there, the P/E declined until 2020, when it reached zero, causing negative earnings per share. Today, the /E stands at an interesting 9.7 points. The company is 47.7% undervalued according to our Fair Price Index on Bulios.

Rivals

Woodside Energy Group Ltd $WDS+3.6%: is an Australian oil and gas company that is one of the biggest players in the energy sector in the region. The company was founded in 195. Woodside specializes in the exploration, production and processing of natural gas and oil. One of the company's most significant projects is the North West Shelf Project, which is one of the largest LNG projects in the world. This project involves the extraction, processing and export of natural gas and condensates and is critical to Australia's export sector.

TotalEnergies SE $TTE+1.6%: This company operates in more than 130 countries and its activities span all stages of the energy sector value chain. The company is a major player in the oil and gas market, with extensive operations in Africa, the Middle East, Europe, North and South America and Asia. The company is also one of the world's leading producers and traders of LNG, a key part of its portfolio. In recent years, TotalEnergies has invested significantly in renewable energy sources such as solar and wind power plants, with the aim of transitioning to a low-carbon energy mix.

Ovintiv Inc $OVV+1.1%: The company specializes in the development of unconventional oil and gas resources, particularly from shale formations. Its core activities are concentrated in a few key areas: the Permian Basin in Texas, the Anadarko Basin in Oklahoma, and the Montney Basin in Western Canada. These areas are known for their abundant reserves of unconventional oil and gas, which Ovintiv is efficiently producing using advanced technologies such as horizontal drilling and hydraulic fracturing.

Blue - $IMO+2.9%, Yellow - $OVV+1.1%, Orange - $WDS+3.6%, Turquoise - $TTE+1.6%

Over the last 3 years and 7 months, $IMO+2.9%is the best performing company in terms of growth , with its stock posting a whopping 181% appreciation. In second place with 103% growth over the same time period, we have $OVV+1.1% from today's comparison . While $TTE+1.6% is still in profit (31.5%), it's already significantly less than the previous two companies. In last place, then, we have $WDS+3.6%. Its stock is down 23% since 2020. But thanks to this decline, it is now trading 33% below its fair value according to our Fair Price Index.

Future plans

Development of mining projects: The company plans to continue to develop its mining operations, particularly in the oil sands. One key project is the expansion of production at the Kearl project, where Imperial Oil is using advanced technology to increase efficiency and reduce environmental impact.

Investment in technology and innovation: $IMO focuses on innovation and technology research to improve the efficiency of its operations. It plans to invest in new technologies to enable more efficient production and processing of oil and gas, while reducing greenhouse gas emissions. At the same time, this will increase production efficiency and therefore boost future earnings.

Developing refining and chemical production capacity: Imperial Oil intends to continue upgrading and expanding its refineries and chemical plants. The aim is to increase production capacity and efficiency to be better able to respond to changing market demands and increase its competitiveness. Although this sector has been rather neglected in recent years, management would like to change this to better balance and diversify the company's business.

Expansion into new markets and portfolio diversification: The company is considering expanding its operations into new geographies and markets. Portfolio diversification includes not only traditional oil and gas projects, but also investments in renewable energy and alternative technologies that support the transition to a low-carbon economy.

Outlook

So far, the company is still enjoying the growth from the end of last year and the beginning of this year. Its shares have gained 43% since the start of 2023 and currently hover between $65 and $72. This has created a bull flag on the stock's chart from a technical analysis perspective. Thus, if the company manages to break out of the current sideways trend by breaking out to a new peak, a rally similar to the one at the beginning of the year could follow. The latest quarterly results have been able to confirm a very strong corporate business setup and hence nothing is holding it back from this perspective. For how volatility has dominated other companies in recent days, this one is holding up very well. How do Wall Street analysts view this?

Of the 20 analysts surveyed, 5 of them would buy the company's stock immediately. Their outlook for the next twelve months foresees a possible share price increase of up to 19.86%. If that were to happen, one share would sell for $83.42 on the market. However, the other 15 would just hold the stock and wait for the next move. On a positive note, no analyst would have eliminated this company from their portfolio. You don't see that very often. And how do you view $IMO? Do you have it in your portfolio?

Disclaimer: You will find a lot of inspiration on Bulios, but stock selection, strategy and portfolio construction is up to you, so always do thorough self-analysis and educate yourself.

Přečíst celý článek? Staň se členem Bulios Black

Vybírej akcie jako profíci s analýzami a nástroji Bulios Black
16.99 USD měsíčně
(lze kdykoliv zrušit)
Usnadni si výběr akcií díky důkladným analýzám top firem
Sleduj výkonnost svého portfolia a dividendy v portfolio trackeru
Získej přehled férových cen akcií 500 nejoblíbenějších firem
Aktuální informace a souhrny výsledků ke tvým firmám
Předplatit členství
Don't have an account? Join us

Log in to Bulios


Sign.popup.orUseEmailAndPassword
Už jsi členem? Přihlásit se

Create Bulios profile

Continue with

Sign.popup.orUseEmailAndPassword
You can use lowercase letters, numbers, and underscores

Why Bulios?

One of the fastest growing investor communities in Europe

Comprehensive data and information on thousands of stocks from around the world

Current information from global markets and individual companies

sign.popup.registration.listWhy.fourth

Fair prices, portfolio tracker, stock screener and other tools

Timeline Tracker Overview