
The S&P 500 hit an all-time high of 7,014 points in late January 2026, but since then, the index has been sliding. What might look like a routine pullback on the surface could be something far more serious. A cluster of technical and fundamental warning indicators are lighting up simultaneously, a pattern that has historically preceded major market selloffs. Stretched valuations, tightening financial conditions, and a slowing economy are converging at the same time, and some analysts are now openly discussing the possibility of a decline as steep as 30% from the peak.
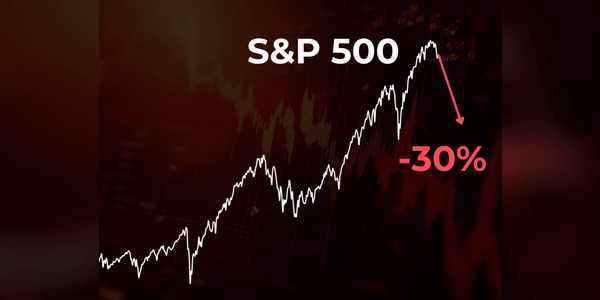
The S&P 500 index, which reached its all-time high of 7,014 points on 28 January 2026, has been losing ground since then. As of 17 March, it is trading around 6 700 points, a decline of approximately 4.7% from its peak. On the face of it, this is a standard correction that normally takes place in the markets. However, a closer look at both technical and fundamental indicators shows that the current situation may herald a…