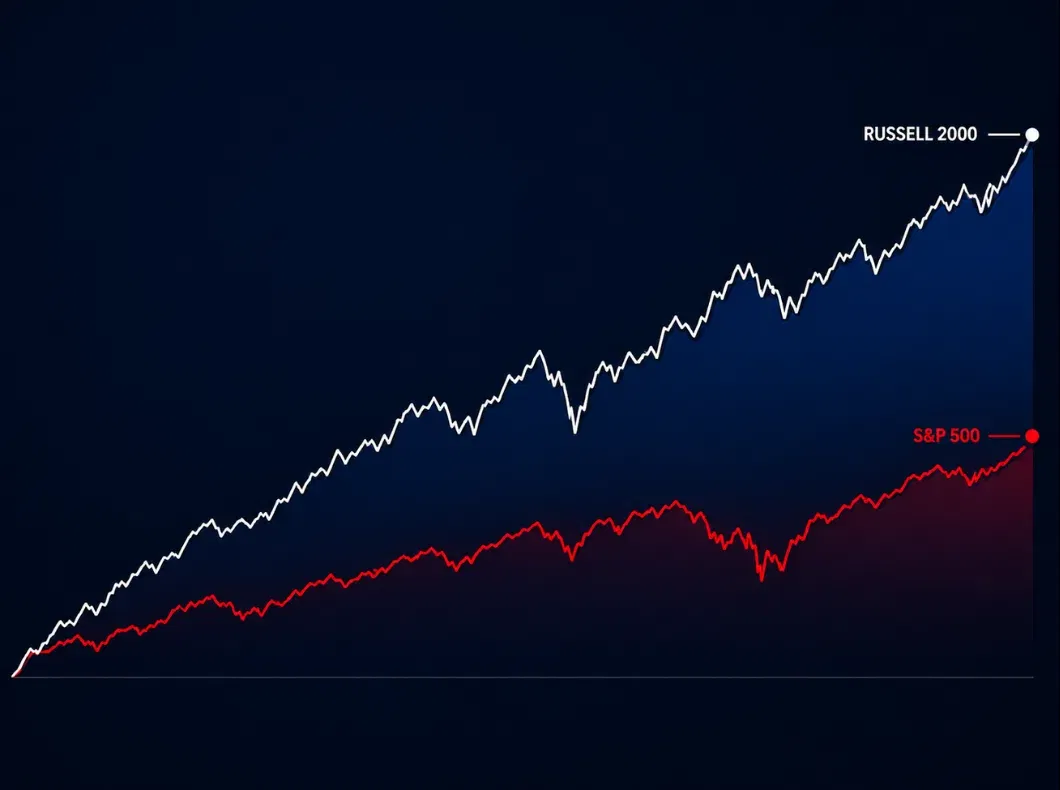
This index beats the S&P 500

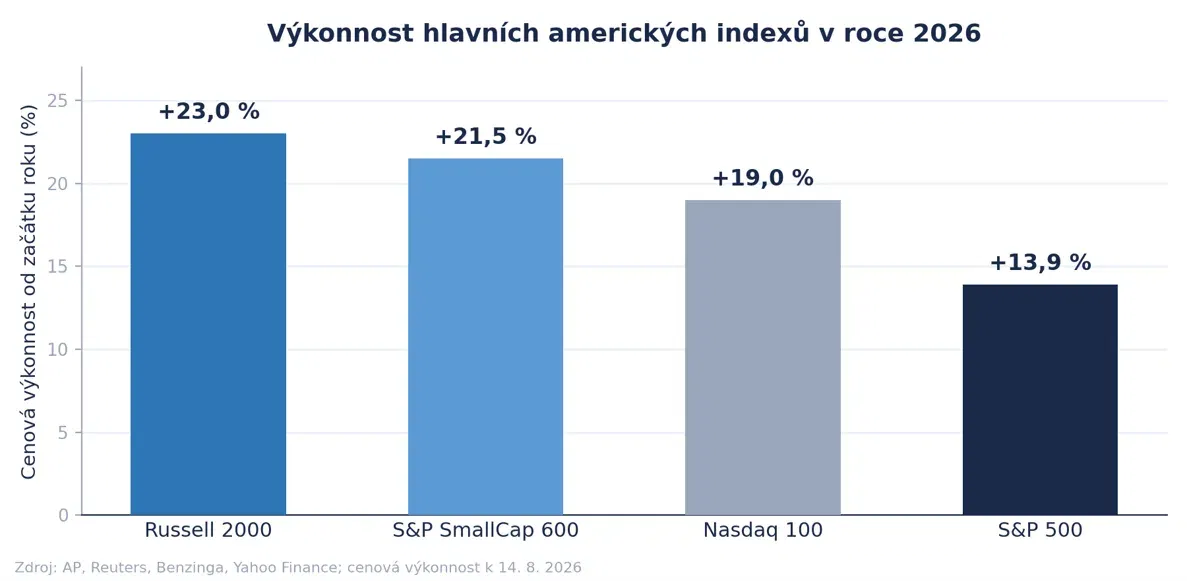
Investor attention has focused on big tech companies for years. But this year a completely different index is leading the U.S. market. The Russell 2000 has gained more than 23% since the start of the year, leaving the S&P 500 behind by roughly nine percentage points. Small companies have come back into play after a long period of underperformance. Is this driven by a real improvement in fundamentals, or just cheap valuations and a greater appetite for risk?
Key points
The Russell 2000 leads the U.S. market this year with a gain of over 23%, beating both the S&P 500 and the Nasdaq 100.
About 40% of companies in the index are unprofitable, yet this group is growing the fastest.
Earnings estimates for small companies are falling this year, while those for large companies are rising. But prices are moving in the opposite direction.
The S&P SmallCap 600 covers the same segment, but thanks to a profitability filter it offers a different risk profile. It is also up more than 20% this year.
The U.S. stock market in 2026 presents a picture that most investors would not have imagined twelve months ago. The S&P 500 is hitting new highs and closed above 7,800 points for the first time in history, but its year-to-date performance lags an index that is talked about far less. The Russell 2000, the main barometer of U.S. small companies, closed at a record 3,052.85 points on August 13 and has gained about 23% since the start of the year. That was its 27th record closing high of the year.
For a retail investor, this is interesting for two reasons.
The first is the capital rotation itself. When market performance broadens beyond a narrow group of tech giants, it is usually seen as a sign of a healthier and less fragile bull market.
The second reason is valuation. Small companies now trade at a significant discount to large companies, which leads some investors to believe that this is the last obviously cheap segment of the U.S. stock market.
The reality, however, is more complex than the return percentage alone suggests. Beneath the surface of strong performance lies the structure of the index, which largely determines whether this year's gains are sustainable. That is why we compared the Russell 2000 with two other indexes: the S&P 500 as a measure of the whole market and the lesser-known S&P SmallCap 600, which covers the same small-cap segment but is built on fundamentally different rules.