


Watch out for these 6 stocks with debt over $10 billion

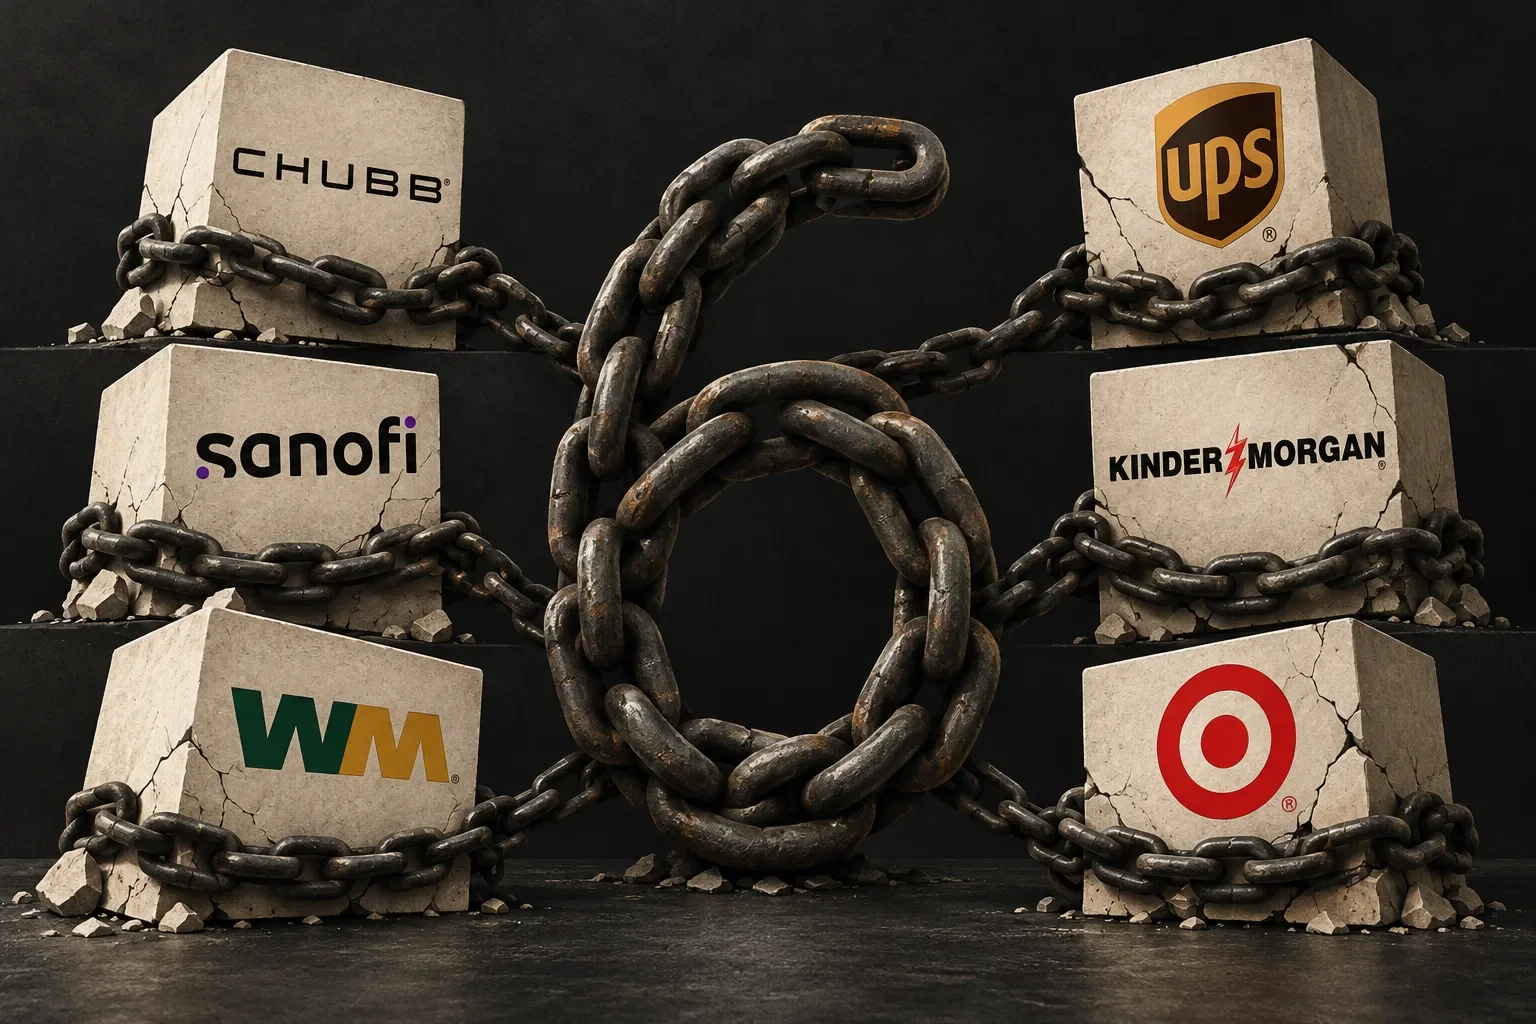
High debt in itself is no reason to panic. But in an environment where companies are refinancing cheap bonds from 2020 and 2021 at significantly higher coupons, it starts to separate companies with robust cash flow from those living on the edge. We looked at six large companies, each owing over $10 billion, and examined how well they can service their liabilities. We can already reveal that the absolute amount of debt is turning out to be the least informative number on the entire balance sheet.
Key points
Six well-known companies owe a combined $155 billion. Yet their actual financial risk differs dramatically. Which metrics reveal the biggest differences?
High debt doesn't have to mean a dangerous investment. Some companies can easily service tens of billions in liabilities, while others hit limits much sooner.
A dividend yield approaching 7% can look tempting. But what if the company uses practically all its cash for shareholder payouts?
Common screeners can significantly distort companies' financial health. The same leverage metric can mean something completely different for an insurer, a logistics company, and an infrastructure operator.
Which companies can handle more expensive financing, and where could higher interest rates start threatening dividends and future growth?
Debt is one of the most oversimplified topics in the stock market. A glance at a screener showing a company's debt in the tens of billions can tempt you to quickly conclude it's a risky investment. In reality, the absolute amount of liabilities is almost worthless if you don't put it in context with how much cash the company generates, how stable its business is, and how much of its operating profitability it must hand over to creditors in interest each year.
The current environment adds considerable weight to this topic. A large share of corporate bonds issued during the zero-rate period will mature in the coming years. Refinancing at current yields means higher interest costs, eating into profit and the room for dividends and buybacks. Companies with thin margin buffers or excessively generous dividend policies will feel it first.
For this overview, we use total debt, which includes lease liabilities. For each company we track three key metrics: debt-to-EBITDA ratio, interest coverage—how many times operating profit covers interest paid—and the relationship between free cash flow and dividend paid. The combination of these numbers shows whether debt is a tool for growth or a potential trap. How are the companies really doing?