


These 5 Companies Profit from Regular Aircraft Maintenance

Engine maintenance and spare-parts supply are among the most profitable parts of aviation, because aircraft fly for decades and cannot take off without certified parts. But companies profit very differently from the same demand, depending on where they sit in the chain. For investors today, what matters is the quality of the business model, financial strength, and the price the market demands for this stability.
Key points
Maintenance is not a single business. Aftermarket revenue ranges from roughly one-fifth to more than two-thirds across companies, and its economics vary just as widely.
The new generation of engines is a hidden trap. Young engines generate significantly less revenue per service visit than older models, so an increase in the number of visits does not mean an equivalent rise in margins.
Manufacturing problems help and hurt. A shortage of new aircraft extends the lives of older fleets and increases demand for maintenance, but ties up capital in inventory and weighs on free cash flow.
Company quality and stock attractiveness diverge. The highest-quality models are either highly leveraged or expensive, while the cheapest stocks come with concentration in older programs.
The market has already started repricing. Some sector stocks fell sharply in 2026, even as earnings continued to grow at a double-digit pace.
Why investors follow aircraft maintenance
For an engine manufacturer and parts supplier, a commercial aircraft is like a printer for an ink manufacturer. The initial sale is usually low-margin, sometimes even loss-making, but it is followed by 25 to 30 years of recurring payments for maintenance, repairs, and spare parts. Whoever gets a part into an aircraft’s certified design secures a long-term claim on a share of its operation.
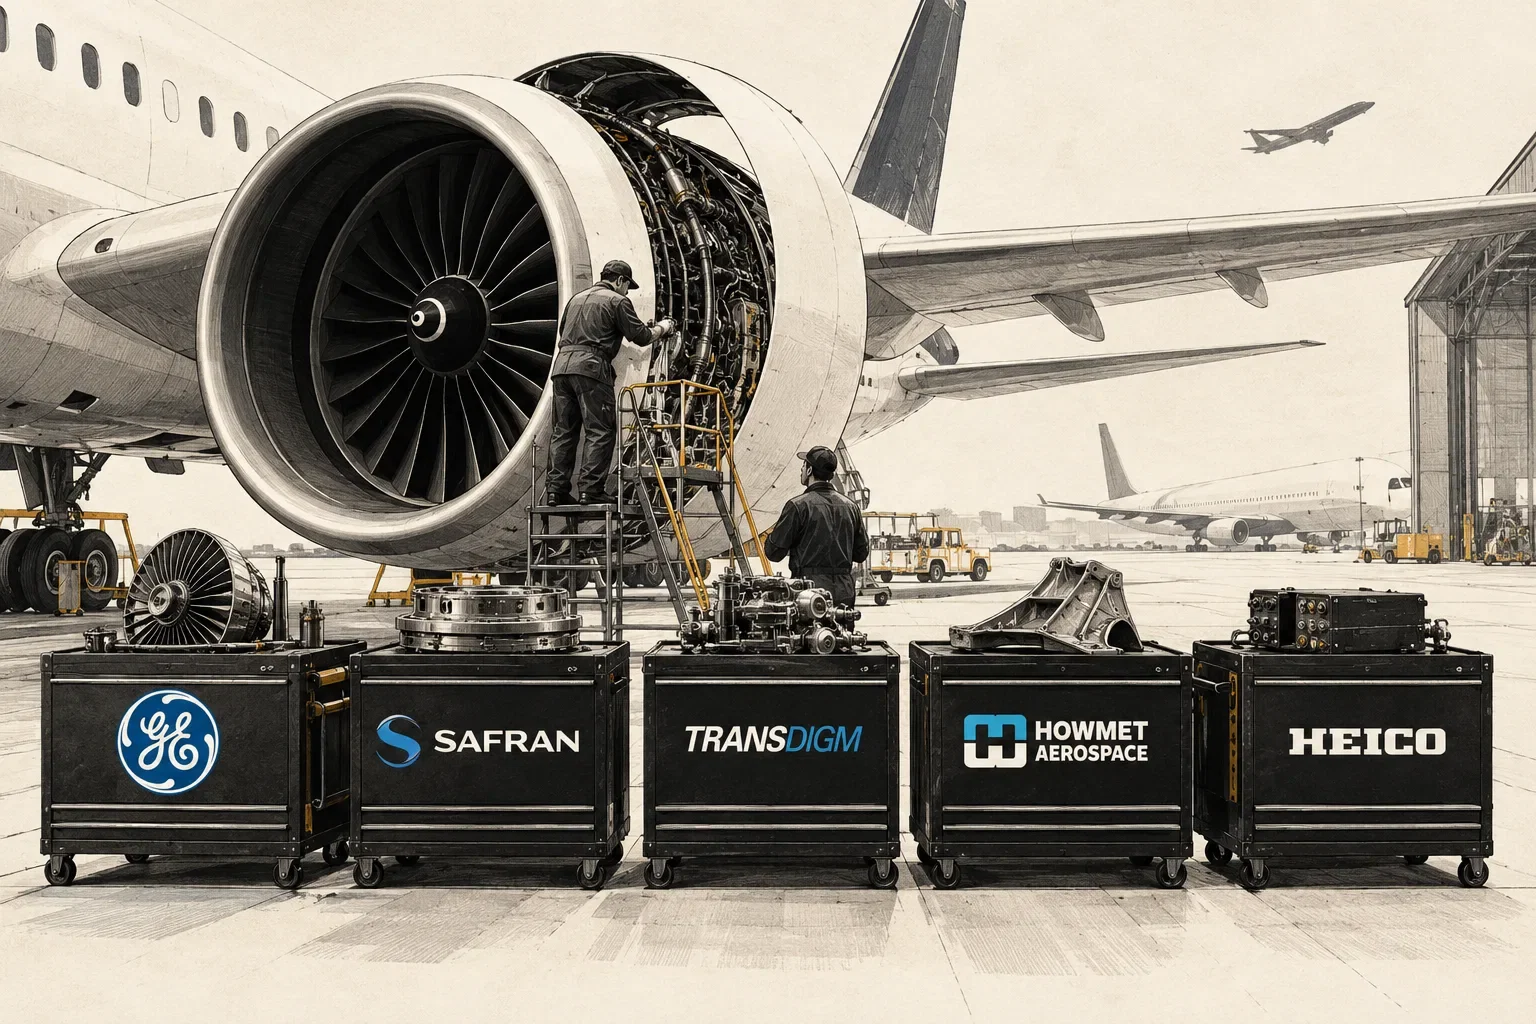
Air travel is above pre-pandemic levels, aircraft manufacturers cannot keep up with demand for new planes, and operators are therefore flying older aircraft for longer. The result is record maintenance revenue at GE Aerospace and Safran, and double-digit aftermarket growth at TransDigm and HEICO. But most of the five stocks trade at multiples that assume the boom will last for several more years. The five companies also occupy different positions in the chain: GE and Safran manufacture and service engines, TransDigm and HEICO mainly sell parts, and Howmet supplies castings consumed in both production and repairs.
The economics of an aircraft’s life cycle
The engine as a long-term subscription
Engines account for the largest share of aircraft maintenance. Turbine blades, combustion chambers, and so-called life-limited parts must be replaced after a specified number of cycles, regardless of their appearance. Safety regulations also determine who may manufacture and repair a part. Aircraft operators therefore cannot simply switch to a cheaper supplier, because every part must have valid approval from an aviation authority.
The companies themselves describe the favorable environment in specific terms. In its 2025 results, Safran attributed aftermarket growth to strong air traffic and the low number of aircraft retirements. On GE’s 3Q 2026 conference call, CFO Rahul Ghai said that retirements of GE90 and GEnx widebody engines numbered only in the single digits this year, and that roughly 70% of the GE90 fleet was still awaiting its second service visit. GE management also expects the number of LEAP service visits to grow at around 25% annually through 2030.
These figures describe the current phase of the cycle, not a lasting growth rate. Today’s double-digit growth in GE and Safran service revenue combines price increases, more extensive inspections, and the temporarily extended service lives of older aircraft caused by a shortage of new planes.
Why the aftermarket is more profitable than new production
For a new engine, the manufacturer negotiates with Airbus, Boeing, and major airlines, which often receive engines at a discount. Spare parts are the opposite: the aircraft is grounded, every day out of service costs money, and an approved part has only one or a few suppliers. Development and certification costs are also incurred once, but the part is sold for decades, so each additional unit carries a high incremental margin.
The other side of the coin
Maintenance demand is not risk-free. It depends on flight hours and cycles, both of which can drop quickly, as 2020 showed. GE’s 3Q 2026 conference call cited a Brent crude price of around 111 USD per barrel, increasing airline costs and pressuring them to cut capacity. New engine generations also initially generate less revenue per service visit, service centers are struggling with shortages of mechanics and parts, and suppliers must invest in capacity before they see a return.
GE Aerospace
What it sells and to whom
GE Aerospace is the world’s largest aircraft engine manufacturer. According to its 3Q 2026 10-Q, it has an installed base of approximately 50,000 commercial and 30,000 military engines, and servicing this base accounts for roughly 70% of revenue. Customers include airlines, leasing companies, aircraft manufacturers, and militaries. Its most significant program is the LEAP engine, manufactured through the CFM International joint venture with Safran, which powers the Airbus A320neo and Boeing 737 MAX.
The company reports two segments. Commercial Engines & Services (CES) includes commercial engines and their maintenance, while Defense & Propulsion Technologies (DPT) includes military engines and components. In the first nine months of 2026, services accounted for 22.0 billion USD of CES segment revenue of 29.0 billion USD, or approximately 76%.
Maintenance as the main source of profit
GE sells new engines at low margins, and even at a loss for new programs such as GE9X, then follows up with long-term service agreements under which customers pay according to flight hours. Program profitability therefore increases as engines age and move into heavier maintenance visits. In 3Q 2026, CES revenue rose 21% to 10.3 billion USD. Services grew 17%, with internal service visits up 12% and spare parts up more than 20%. The segment margin was 27.9%. The commercial service backlog exceeds 170 billion USD, but this represents contracted orders, not revenue.
The key nuance is the transition between generations. According to CFO Rahul Ghai, a service visit for a young LEAP engine generates roughly half the revenue of one for a mature CFM56. LEAP visits grew by approximately 40% in 3Q, and management expects growth of 25 to 26% in 2027, while CFM56 visits are expected to remain around 2,300 to 2,400 per year.
Financial performance
Metric (non-GAAP) | 2024 | 2025 | 9M 2026 | 2026 outlook |
|---|---|---|---|---|
Adjusted revenue | 35.1 billion USD (+10%) | 42.3 billion USD (+21%) | 37.5 billion USD (+23%) | growth of 19 to 20% |
Operating profit | 7.3 billion USD | 9.1 billion USD | 8.3 billion USD | 10.9 to 11.0 billion USD |
Operating margin | 20.7% | 21.4% | 22.0% | 22% |
Free cash flow | 6.1 billion USD | 7.7 billion USD | 6.7 billion USD | 9.1 to 9.4 billion USD |
In 3Q 2026, adjusted earnings per share rose 36% to 2.25 USD, but free cash flow fell 14% to 2.0 billion USD, and the stock declined 3 to 4% after the results. Management raised its 2026 EPS outlook to 8.00 to 8.10 USD. According to management, earnings growth comes from service volume and pricing, while the margin is being pressured by mix, inflation, and losses on the GE9X engine. Certification of the modified seal is expected by the end of 2026, and losses on the program are expected to reach around 300 million USD in 2027.
Main risks
Earnings-to-cash conversion. A sustained decline in the ratio of free cash flow to adjusted earnings below 100% would weaken the main argument for a premium valuation. Watch: quarterly FCF conversion and inventory.
Supplier capacity. LEAP deliveries rose only 5% in 3Q (535 units), compared with 26% for the nine-month period, and parts shortages are also holding back service visits. Watch: LEAP deliveries and service-visit turnaround time.
Margin dilution as LEAP grows. Management itself expects flat service margins in 2027, with growth only from 2028. Watch: CES segment margin.
Greater engine durability. A certified kit for the LEAP-1B is expected to roughly double the time between inspections, slowing service revenue billed for work performed. Watch: service visits per flight cycle.
Safran
What it sells and to whom
Safran is a French group with three divisions: Propulsion (propulsion systems), Equipment & Defense (aircraft equipment and defense technology), and Aircraft Interiors (cabins and seats). The key division is Propulsion, which includes Safran’s share of the CFM56 and LEAP programs, helicopter turbines, and M88 military engines.
CFM International is a 50 : 50 joint venture between GE and Safran. Safran manufactures the low-pressure section of the engine, and its share of deliveries and service revenue is reflected in the Propulsion division, rather than being merely a share of an affiliated company’s profit. The economics of LEAP and CFM56 affect Safran in much the same way as GE, but on a smaller scale and in euros.
Safran does not disclose the aftermarket share of group revenue. The closest indicator is the Propulsion revenue breakdown: in 1Q 2025, services accounted for 2,381 million EUR of 3,684 million EUR, or approximately 65%.
Economics: CFM56 as a source of cash
For 2025, Safran reported revenue of 31.3 billion EUR (+14.7%) and recurring operating profit of 5.2 billion EUR, with a margin of 16.6% (15.1% in 2024). Propulsion’s margin reached 23.0%, primarily thanks to CFM56 parts.
According to its 1H 2026 results, adjusted revenue rose 19.0% to 17.6 billion EUR and recurring operating profit increased 29.0% to 3.24 billion EUR (a margin of 18.4%). Civil engine spare parts grew 27.9% in dollars, and services grew 40.4%. Propulsion’s margin reached 24.5%, Equipment & Defense’s was 13.1%, and Aircraft Interiors’ was just 3.7%. The group’s earnings are therefore driven almost entirely by the engine aftermarket. Safran also notes that Propulsion’s margin is being dampened by rising LEAP deliveries with a lower share of spare engines, and by LEAP services paid for by flight hour—the same mechanism as at GE.
Adjusted versus consolidated results
Consolidated IFRS earnings include revaluation of currency hedges. As a result, in 1H 2025 consolidated earnings per share were 12.07 EUR, compared with adjusted earnings of just 3.80 EUR. In 1H 2026, the relationship was reversed (4.21 EUR versus 4.63 EUR). P/E based on consolidated figures is therefore distorted, and adjusted earnings are more appropriate. Safran has hedged the EUR/USD exchange rate at 1.12 for 2026 to 2028, with net exposure of 16 to 17 billion USD annually, so a stronger euro will only show through when the hedges are renewed.
Outlook and balance sheet
In July, management raised its 2026 outlook to revenue growth in the mid-teens, recurring operating profit of 6.4 to 6.5 billion EUR, and free cash flow of 4.7 to 4.9 billion EUR, including an estimated 500 million EUR impact from France’s exceptional profit tax. As of June 30, Safran had net cash of 1.67 billion EUR.
Main risks
CFM56 peak. Sales of CFM56 parts are currently at a record high. When these engines begin to retire in greater numbers, some of the most profitable revenue will disappear. Watch: quarterly growth in spare-parts sales in USD.
Currency. Most revenue is in dollars, while most costs are in euros. Watch: the hedged rate for 2029 and 2030.
Supply chain. Management itself cites this as an item to monitor. Watch: LEAP deliveries against the low-double-digit growth outlook.
Low-margin divisions. Interiors, with margins around 4%, reduces the quality of the overall business. Watch: progress on the sale of cabin-related activities.