


4 ETFs Tracking Undervalued Small U.S. Companies

The four best-known U.S. small-cap value ETFs have almost identical names, but each buys a different portfolio. They differ in how they define a small company, their emphasis on profitability, and their costs, which range from 0.05% to 0.27% per year. Over the past five years, the gap between the best and worst performer was 4.5 percentage points per year.

Key points
Five-year returns differ by 4.5 percentage points per year across the four funds. As of 30. 9. 2026, the best-performing fund returned 11.17% annually, while the weakest returned 6.66%. The difference is mainly due to methodology, not chance.
The strongest profitability tilt is more than double that of the index. The weighted ratio of earnings to book value is 0.32, compared with 0.14 for the small-cap value benchmark index.
A “small company” can have a median market capitalization of USD 9.9 billion. The broadest definition reaches into a range that other providers classify as mid-cap companies.
Small-cap value companies trade at 17.3 times earnings, compared with 29.7 times for large U.S. companies. The segment is significantly cheaper, but cheapness alone does not guarantee higher returns.
A 0.20 percentage-point annual difference in costs amounts to 3.6% of the final value over 20 years. An active factor tilt must deliver more in the future than it costs.
The U.S. stock market is highly concentrated today. Information technology makes up 38.6% of the iShares Core S&P 500 fund, and the index trades at nearly 30 times earnings. Investors looking for a counterbalance often turn to small-cap value companies. However, the four best-known ETFs in this segment are not interchangeable. Only IJS and VBR actually track an index; AVUV and DFSV are systematically managed active funds. Choosing between them is really a choice between four definitions of what constitutes a small, cheap company.
What small-cap and value mean
There is no single definition of a small company
The term small-cap refers to companies with relatively low market capitalization, but each provider sets the cutoff differently. The Russell 2000 index includes the 2,000 smallest companies out of the 3,000 largest. The S&P SmallCap 600 index is assembled by a committee and requires positive accounting earnings. Avantis and Dimensional set their own thresholds, based on the smallest 10% of market capitalization or companies smaller than the 1,000th-largest U.S. company. As a result, AVUV’s weighted-average market capitalization is USD 3.7 billion, while VBR’s median is USD 9.9 billion.
Value is measured by ratios, not opinion
Value stocks are companies with low prices relative to their book value, earnings, revenue, or cash flow. The price-to-book ratio (P/B) compares the market price with shareholders’ equity on the balance sheet; the price-to-earnings ratio (P/E) compares the price with net earnings. Small-cap value therefore selects smaller companies that the market values cheaply. This basket has a different risk profile from the broad market: more banks, industrials, energy, and cyclical consumer goods, and significantly fewer technology giants.
Why a premium may exist—and why it may not materialize
Academic research by Eugene Fama and Kenneth French described the historical premium of small and cheap companies. One explanation views it as compensation for higher risk, since smaller and more indebted companies weather recessions less well. Another attributes it to investor behavior, with investors overpaying for appealing stories. Based on data from 1963 to 2025, Avantis reports that cheaper and more profitable U.S. companies returned 13.8% annually, while more expensive and less profitable companies returned 6.4%. This is an analysis by a manager whose product is built on this premium, using historical data that do not guarantee the pattern will recur.
Low valuations often reflect real problems: declining revenue, debt, or a structurally declining industry. Such a “value trap” can remain cheap indefinitely. The segment can also underperform for years. From 2023 to 2025, the S&P 500 fund returned 26.3%, 25.0%, and 17.8%, respectively, while none of the four ETFs tracked here exceeded 23% in any of those years. A low valuation is compensation for risk and discomfort, not a free discount.
Avantis U.S. Small Cap Value ETF
An active fund without an index
AVUV was launched by Avantis Investors, part of American Century Investments, in September 2019. The fund does not track an index and uses the Russell 2000 Value as its benchmark. Managers evaluate market prices and accounting data daily and adjust the portfolio on an ongoing basis. Unlike a conventional passive ETF, it does not wait for an index rebalance and can remove a company as soon as it no longer meets the criteria. It is a rules-based approach without subjective individual stock selection, rather than conventional active management.
Price, book value, and profitability
The strategy is based on a valuation equation: a stock’s expected return depends on its price, book value, and expected earnings. The fund therefore overweights companies with a low price relative to book value and high operating profitability. It measures value using an adjusted book-to-price ratio and profitability using an adjusted ratio of operating cash flow to book value. The fund also excludes real estate investment trusts (REITs), whose book value is difficult to compare with that of industrial companies.
What investors actually own
As of 30. 9. 2026, the fund managed USD 30.4 billion across 794 stocks. The weighted book-to-market ratio was 0.61, compared with 0.51 for the index, and the weighted earnings-to-book-value ratio was 0.32, compared with 0.14. A total of 77% of assets was allocated to the cheapest and most profitable quartile of the market, compared with just 33.5% for the index. By sector, the fund significantly overweights energy (16.3% versus 7.9%) and cyclical consumer goods (18.1% versus 9.0%), while healthcare accounts for just 4.0% versus 12.1%. AVUV is therefore not a mildly adjusted index, but a concentrated bet on a combination of cheapness and profitability.
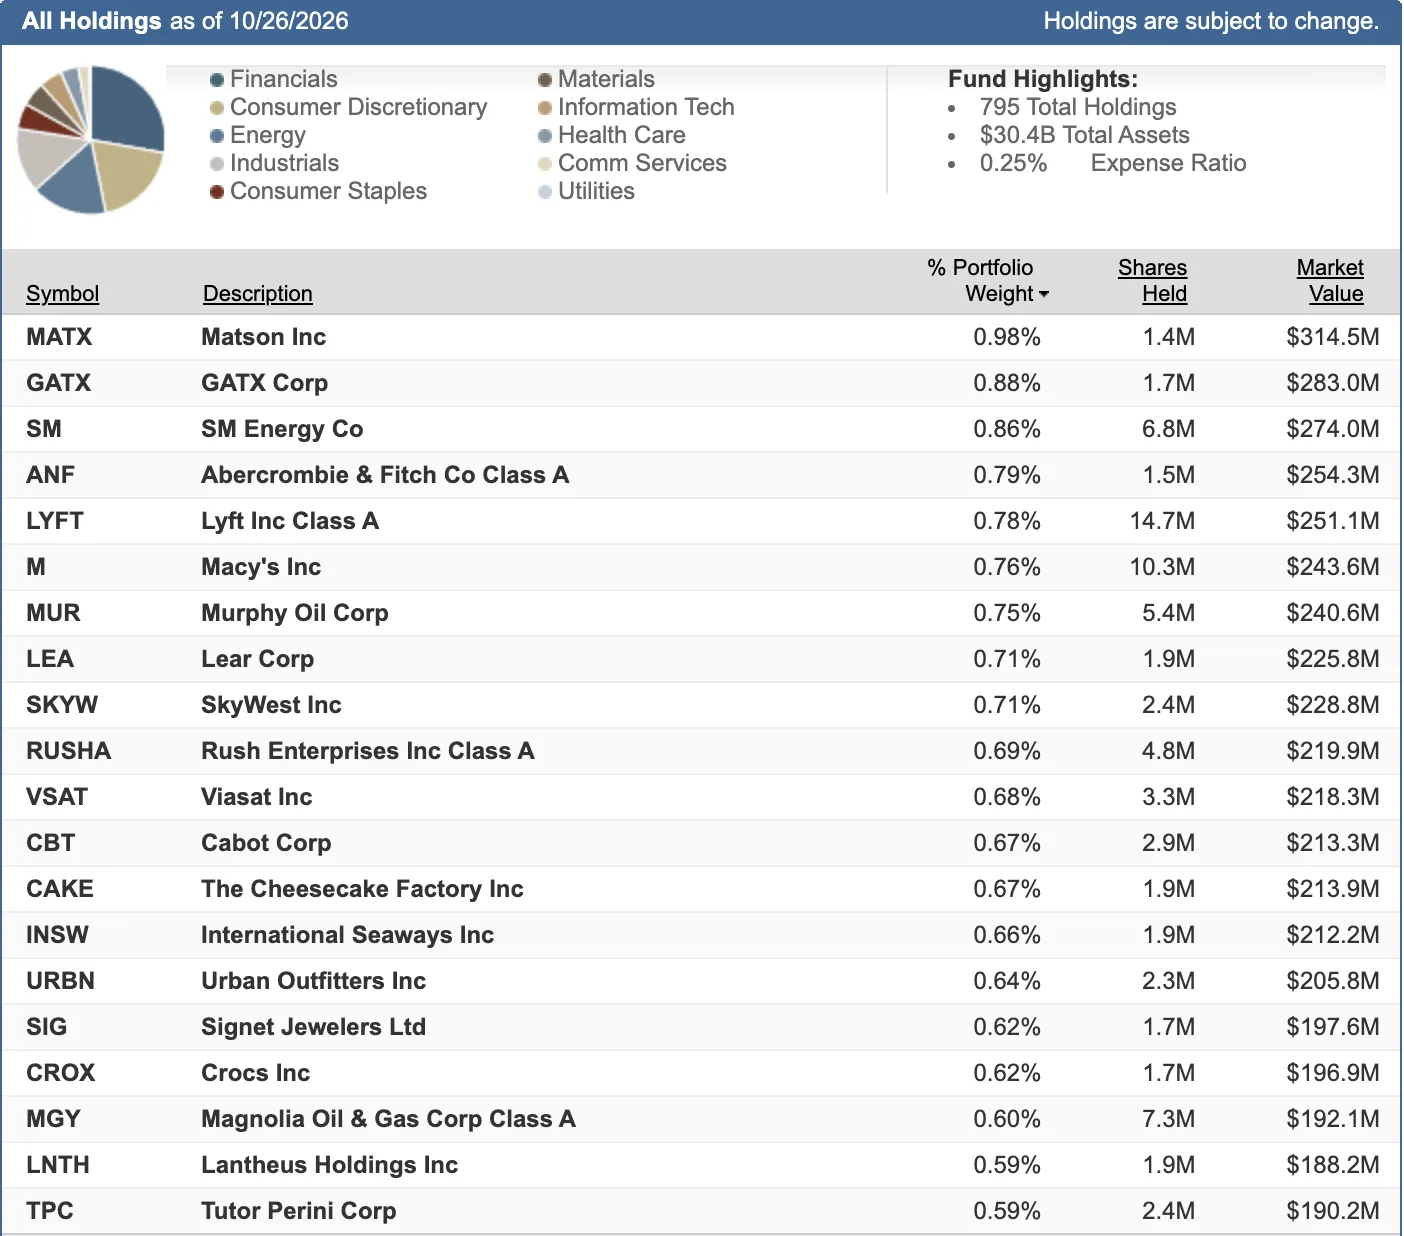
Summary of the 20 largest holdings in ETF $AVUV
Turnover, costs, and deviation from the market
The expense ratio is 0.25% per year. Morningstar reports portfolio turnover of around 6%, less than for IJS, because the fund trades continuously in small increments rather than making a single annual reshuffle. The price of a distinct profile is the risk of deviating from the market. In the third quarter of 2026, the fund lagged the index because it did not hold some index biotech companies that rose sharply.
Measurable benefit of the strategy
As of 30. 9. 2026, AVUV returned 11.17% annually over five years, compared with 7.80% for the Russell 2000 Value index, and 14.80% since inception, compared with 10.61%. Over the past year and three years, however, it lagged the index by 0.86 and 1.32 percentage points, respectively. A seven-year track record is short for a factor strategy, and much of the lead was generated from 2021 to 2023. The data confirm that the strategy has worked, but so far do not cover a full economic cycle.