


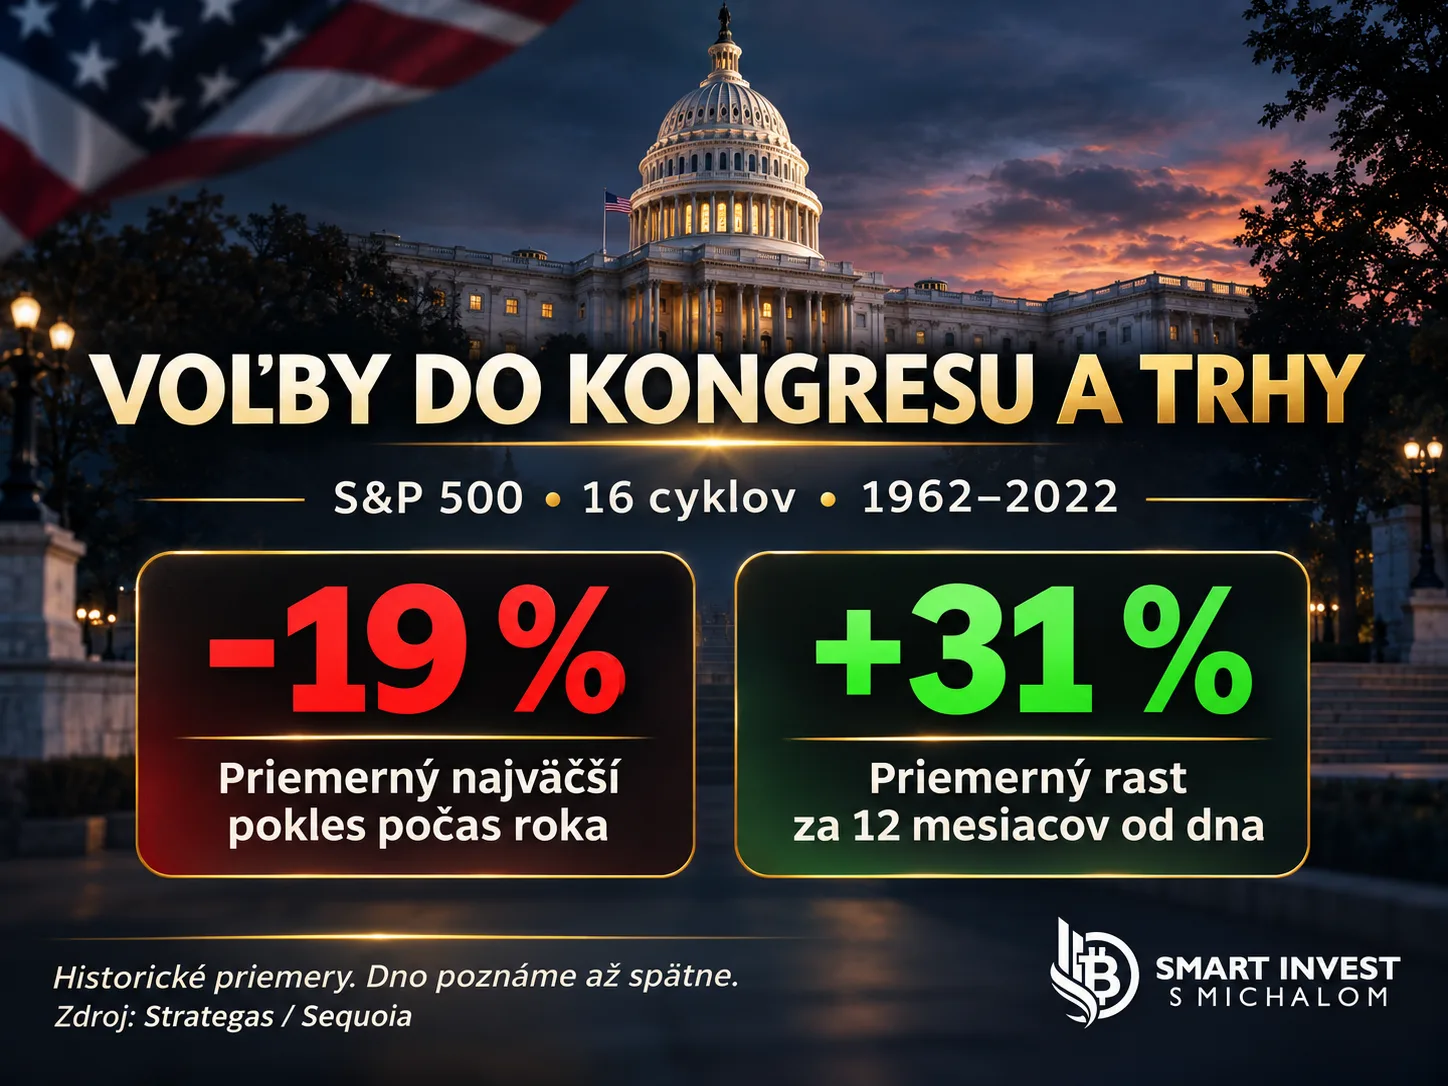
📉 Congressional elections and the markets: what does history show?
Strategas tracked the S&P 500 in 16 U.S. midterm election years, from 1962 to 2022.
🔴 The largest decline during such a year averaged approximately 19%.
🟢 In the 12 months after its low, the index rose by an average of approximately 31%. It was higher in all 16 cases.
An important detail: the gain is measured from the market low, which we only know in hindsight—not from the election date or the date of our purchase.
For me, this is a reminder of why it’s important to keep a longer-term perspective during declines and stick to a plan. It’s not a prediction that history will repeat itself.
Source: Strategas Research Partners, analysis dated 30. 3. 2026, cited by Sequoia Financial Group.
This is my personal view, not investment advice. Investing involves the risk of loss of capital, and past performance does not guarantee future results.
