Bulios now calculates fair share prices with a new model. It shows a range, three scenarios, and how reliable the estimate is

Instead of a single number, a range from a pessimistic to an optimistic scenario, confidence in the estimate, and warnings that explain what makes it less reliable. The new Bulios Fair Price is available on every stock's detail page.
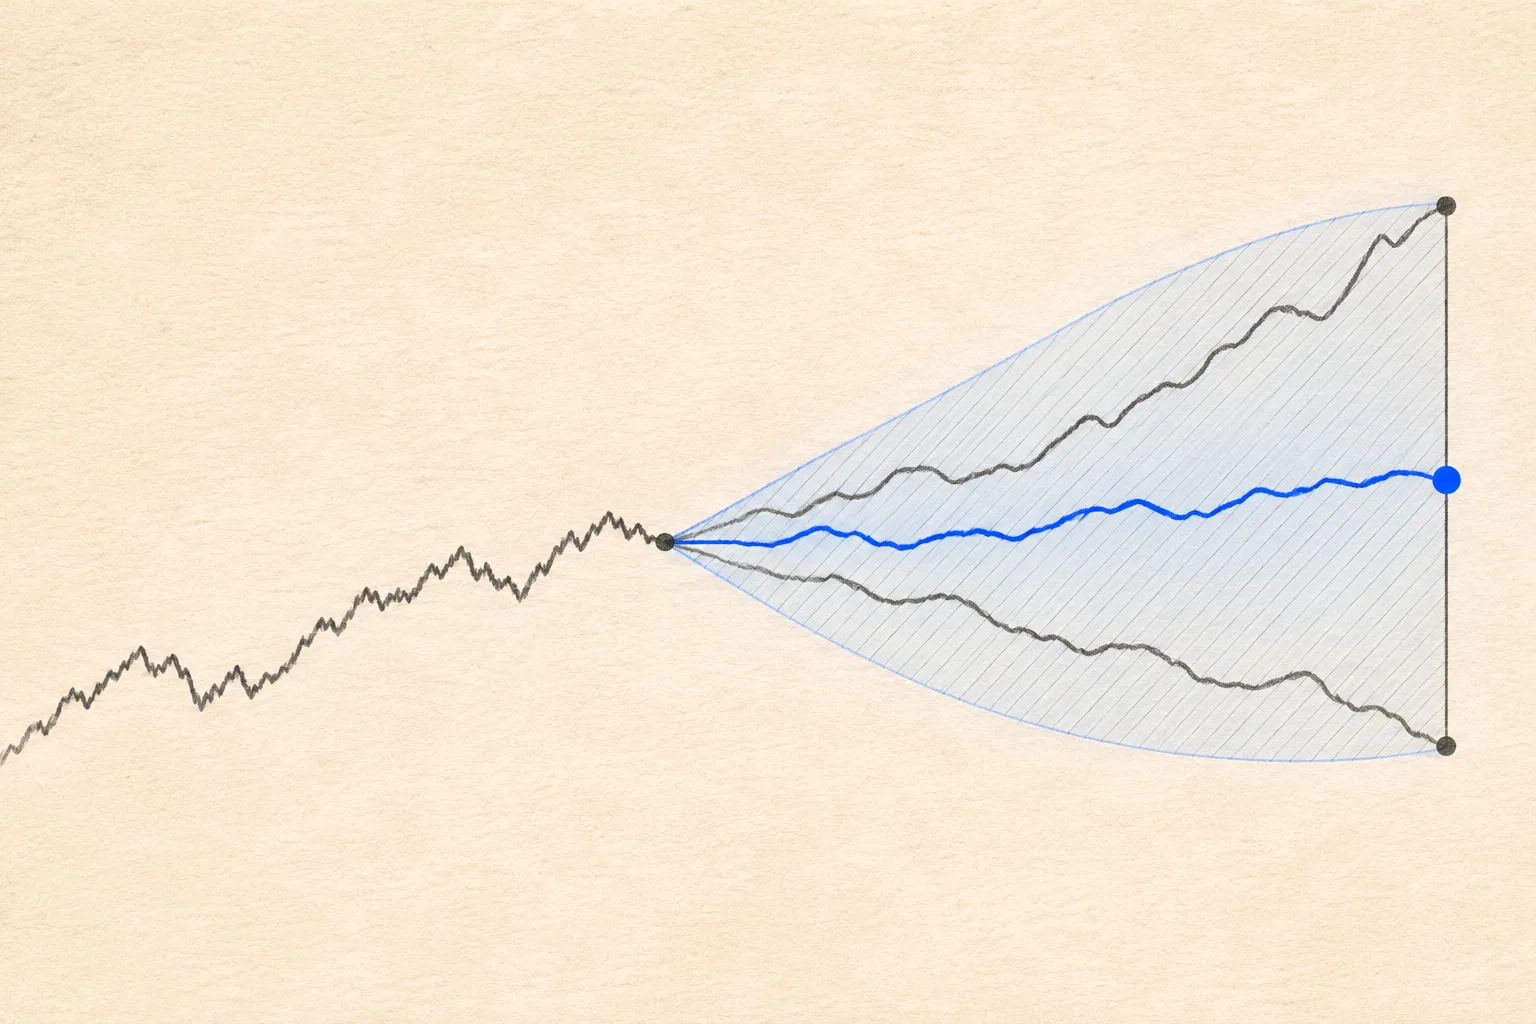
A single fair price number looks more precise than a company's valuation can really be. Coca-Cola sells a similar amount every year, so its value can be estimated within a narrow range. An oil producer's profits depend on the price of a commodity that no one can predict in advance. That's why the new Bulios Fair Price shows a range from a pessimistic to an optimistic scenario alongside the main figure, and indicates how reliable the estimate is and what makes it less reliable. It's calculated by a new model that combines two ways of looking at a company: how much money it will earn in the coming years and how much the market pays for similar businesses. It's recalculated every night and available on every stock's detail page.
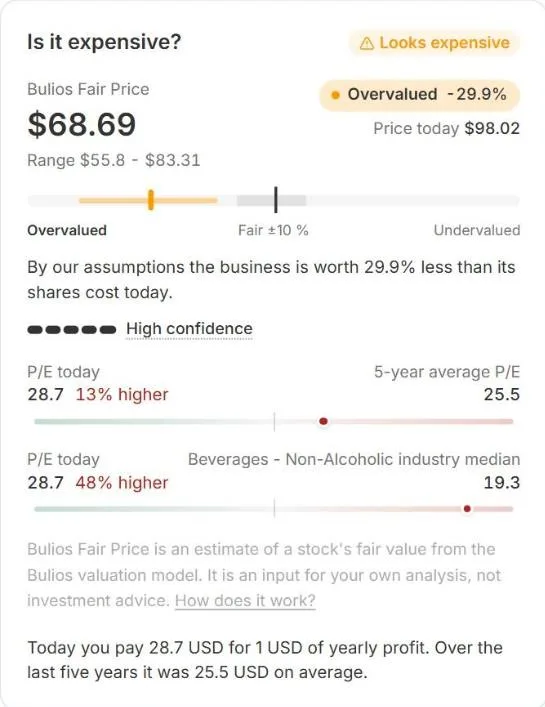
Coca-Cola in the Is the stock expensive? card: Bulios Fair Price with a range, today's price, verdict, and both on one scale.
Price and value on one scale
On a stock's detail page, the fair price answers the question Is the stock expensive? At the top is the Bulios Fair Price with its range, today's price alongside it, and a verdict: Undervalued, Fair Value, or Overvalued. Below them is a scale showing the price, value, and entire range all at once. One sentence then tells you by what percentage the company's value differs from its share price. You can also add the same card to a post on Bulios.
What the new fair price shows
- Range. Pessimistic, base, and optimistic scenarios instead of one number.
- Two perspectives. The money the company will earn in the coming years and a comparison with similar businesses.
- Confidence. High, medium, or low, based on the completeness of the data and how closely the two methods agree.
- Warnings. Reasons why the estimate is less reliable, listed directly below the figure.
- ±10% band. When the value differs from the price by less than a tenth, the stock is fairly valued.
- Recalculated every night. Each company has one value across all exchanges, converted into the currency of the given exchange.
Two perspectives on one company
The first perspective calculates how much money the company will earn over the next ten years and what that money is worth today. The estimates for the first years are based on analysts' forecasts; after that, growth slows toward the economy's long-term rate. The model subtracts investments the company needs to make for growth to be possible, and values riskier businesses more conservatively than stable ones. The second perspective looks at the market. It selects the fifteen companies most similar in size, growth, and margins, and looks at how much investors pay for them and how much they have paid for this company over the past ten years. The fair price is the average of the two perspectives. Today's share price is not part of the calculation; otherwise, the model couldn't say whether a stock is expensive or cheap. Banks, insurers, utilities, and real estate funds have their own valuation methods because debt is part of their business.
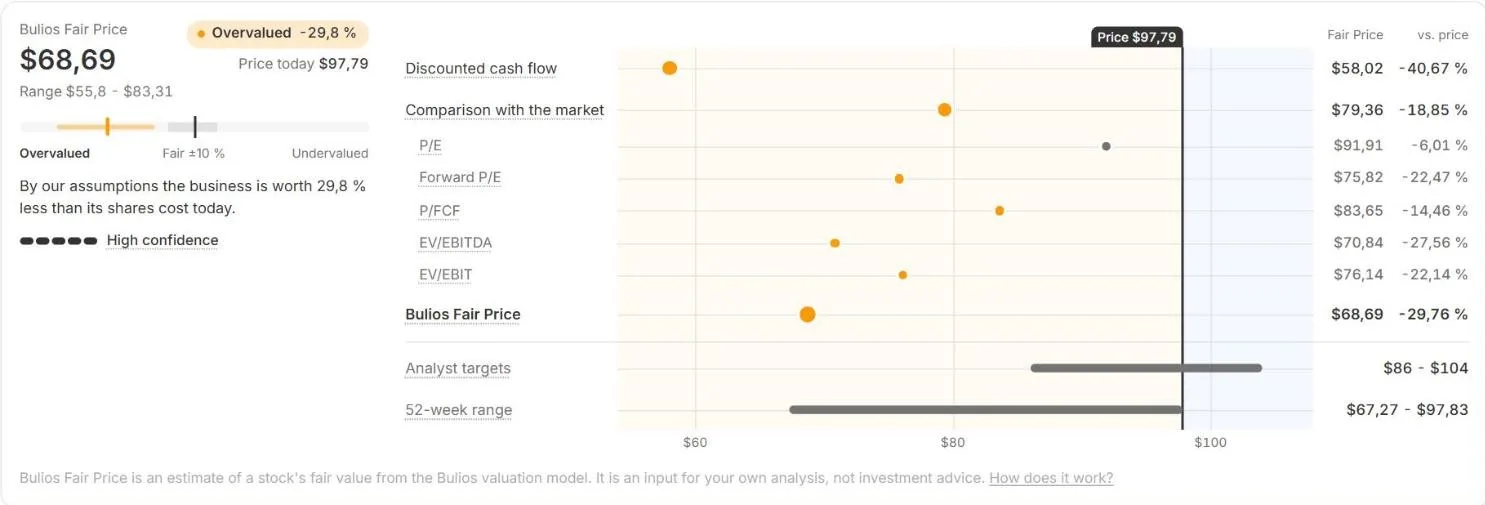
Coca-Cola in advanced view: both methods, analyst price targets, and the 52-week range on one axis with today's price.
Three scenarios, with ranges based on company stability
The pessimistic and optimistic scenarios show where the worse-performing and better-performing quarters of companies as stable as the one you're looking at ended up. Half of the cases should fall between them. That's why the range differs in width for every company. In the pessimistic scenario, Coca-Cola's operating profit is 26% lower than in the base case, and in the optimistic scenario, 35% higher. For Exxon, it's 50% lower and 98% higher. A narrow range belongs to a company whose results are predictable. A wide range means that a lot depends on how the company performs, and that the main figure should be viewed with greater caution.
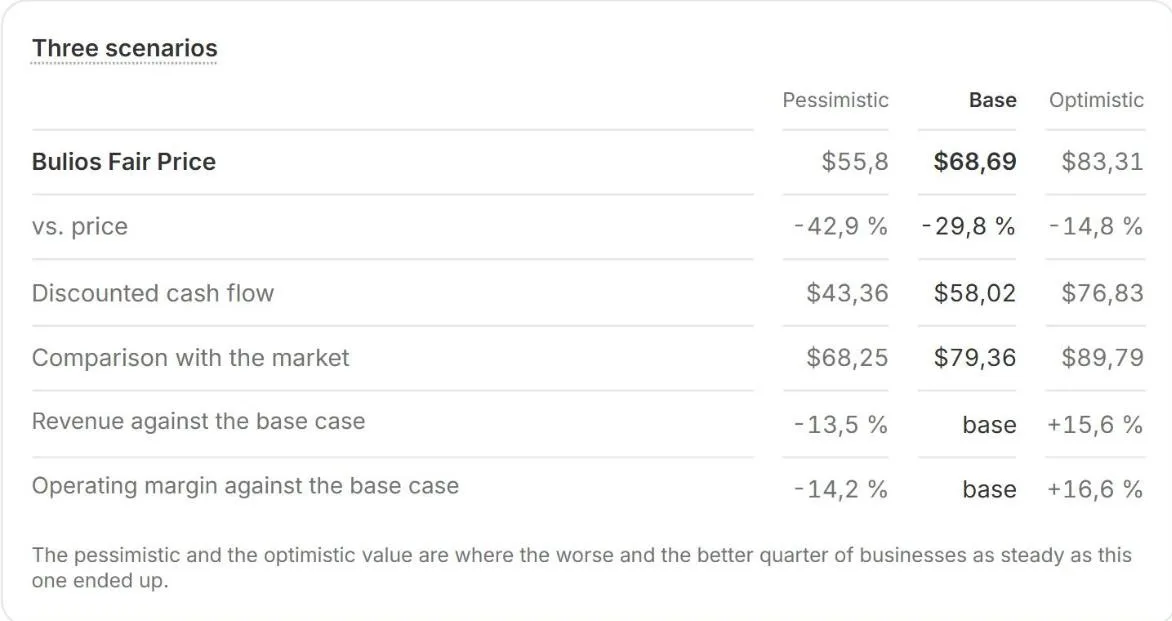
Coca-Cola's three scenarios: share value, distance from the price, and the assumptions that differ between scenarios.
Confidence and warnings: when to rely on the figure
The fair price includes a confidence rating: high, medium, or low. It indicates how complete the data is and how closely the two methods agree. Every warning lowers confidence, and Bulios lists them directly below the figure. For example, you'll learn if the two methods differ significantly, if analyst estimates are missing, if the company has a short track record or high debt, or if its margins are at a cyclical peak and the model uses the current year's margin. Confidence does not predict whether the verdict will prove correct. The fair price is an estimate of a company's value and an input for your own analysis. It won't tell you where the share price is headed tomorrow.
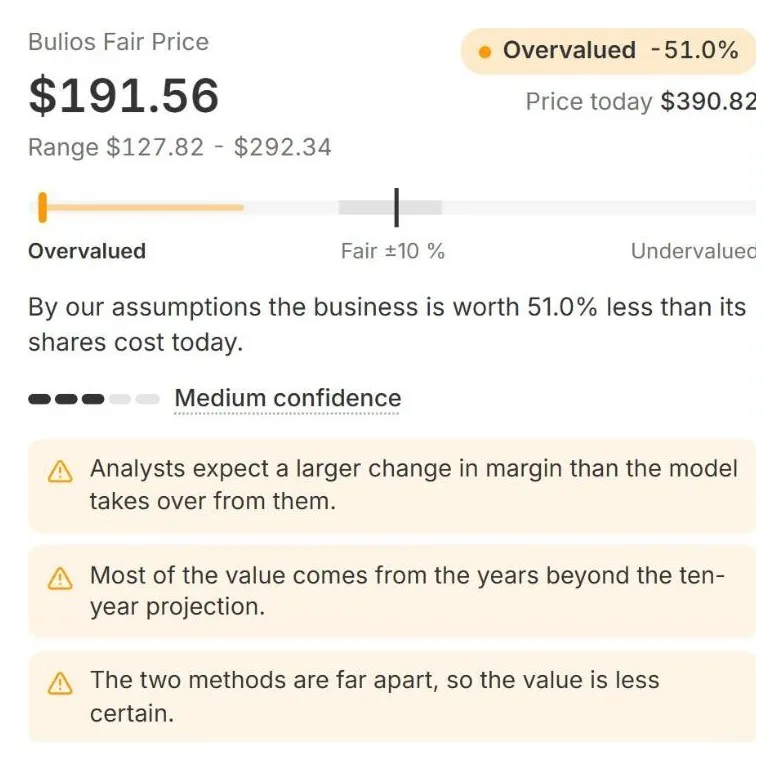
Tesla: medium confidence and three warnings that explain why the estimate is less reliable.
Why the figure for your stock has changed
The new model values companies differently from the previous one. As a result, the fair price and verdict have changed for some stocks, in some cases significantly, and we expected that. To avoid a sudden change, the range through 12. 12. 2026 includes the previous estimate too and will gradually narrow to the new model. For these stocks, a note about the transition is displayed instead of a confidence rating for now. The fair valuation band has also changed. A stock is fairly valued when its value differs from its price by less than 10%; previously, the threshold was 5%. As a result, fewer stocks are marked as undervalued or overvalued than before. We no longer provide a fair price for some securities, such as preferred shares and companies without their own business operations.
How to use it
1. Open the detail page for any stock.
2. In the Is the stock expensive? card, you'll find the Bulios Fair Price with its range, verdict, and scale.
3. Read the confidence rating and warnings below the figure. They tell you how reliable the estimate is.
4. Switch the depth setting to Advanced and explore both methods, the three scenarios, and where the value comes from in the Valuation section.
The images in this article show fair prices as of 12. 11. 2026; the prices and data in them change every day. Bulios Fair Price is an estimate from a valuation model, not an investment recommendation. Always do your own analysis.