These 2 indicators predict when the bear market could bottom

In the first half of the year, everyone was panicking about the bear market, then it looked like the market had gone through its ordeal and we would be back in the green numbers. But that started to turn around as the end of the holiday season approached and now the mood is becoming very skeptical again. Below, we'll take a look at 2 indicators that tell us what we should be preparing for.

There are a number of reasons to panic, although a lot has been written about them, but it seems to me that they are quickly being forgotten again. Inflation, interest rates, the energy crisis, the tense geopolitical situation due to the war in Ukraine, and the risks of war in Taiwan. In addition, the S&P 500 $^GSPC+0.9% index closed in negative percentages for the third consecutive week this past Friday, and is now down slightly over 17% from the start of the year.
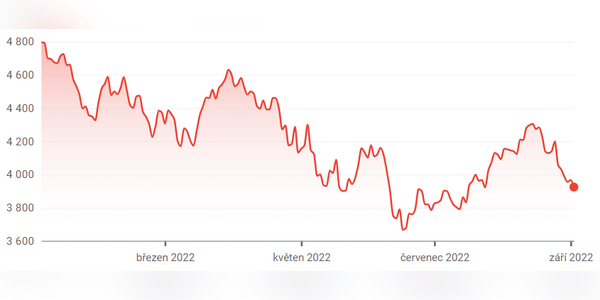
S&P 500 year-to-date performance, source.

1. Forward PE ratio of the S&P 500 index

This metric is calculated by dividing the aggregate point value of the S&P 500 and the consensus EPS forecast for Wall Street, which in our case is for 2023. Based on the historical values of this metric, we are able to predict to some extent how much further the index must swing down to reach a bottom and then subsequent bull runs.

Since the 1990s, the forward PE ratio, with two exceptions, the 2008 crisis and the 2011 decline, has always reached between 13 and 14 during bear markets . Currently, this metric is at 16.8. To reach the bottom, the S&P 500 would still need to fall 16.7% to 22.6%. That's still a decent way down, which should put the index between 3081 and 3315 points.

2. Margin debt

Margin debt, or margin debt, describes the amount of money that investors borrow with interest to buy or short securities. It is common for this debt to increase as the stock price increases. The problem, however, is when this debt grows by units of percent. This is what has happened now in July, when the debt rose by 2%.

The grey bars indicate recession, the red line margin debt and the blue line S&P 500 performance; source: advisorperspectives.com

In the chart we can see the correlation between the massive rise in margin debt and the subsequent declines in the S&P 500. Margins have grown by more than 60% in a 12-month period only three times since 1995. Before the dot-com bubble burst in 2000, before the mortgage crisis in 2007, and then in 2021. After the previous two times, the index lost 49% and 57%, respectively. While there have been sharp declines in margins this year, the data for July suggests that the upward trend is returning. Moreover, given that the index has lost only 17% since the beginning of the year, a bottom may not be far from the order of the day.

Summary

In conclusion, I would like to note that the metrics given should be taken with a grain of salt. While historical context is great, each crisis has had its own specifics. In any case, I think it is at least good to know about it and take it in.

What's your view, are we in for some fall sell-offs and stock market crashes? If so, how are you preparing for it? If not, why do you think it won't happen? Thank you for your answers 😄

Read the full article for free?
Go ahead 👇

Do you have an account? Then log in . Or create a new one .

how am I good at trading, stocks, choosing a classy broker

Please help me

how am I good at trading, stocks, choosing a classy broker

Please help me

I Like Your Post.

I Like Your Post.

I Like Your Post.

I Like Your Post.

I Like Your Post.I Like Your Post.

Don't have an account? Join us

Log in to Bulios


Sign.popup.orUseEmailAndPassword
Už jsi členem? Přihlásit se

Create Bulios profile

Continue with

Sign.popup.orUseEmailAndPassword
You can use lowercase letters, numbers, and underscores

Why Bulios?

One of the fastest growing investor communities in Europe

Comprehensive data and information on thousands of stocks from around the world

Current information from global markets and individual companies

sign.popup.registration.listWhy.fourth

Fair prices, portfolio tracker, stock screener and other tools

Timeline Tracker Overview