Is there any point in dealing with share valuation?
US stocks are expensive, investors have been hearing for years from all sides. Yet a major correction is not coming. Have standard valuation indicators stopped working?
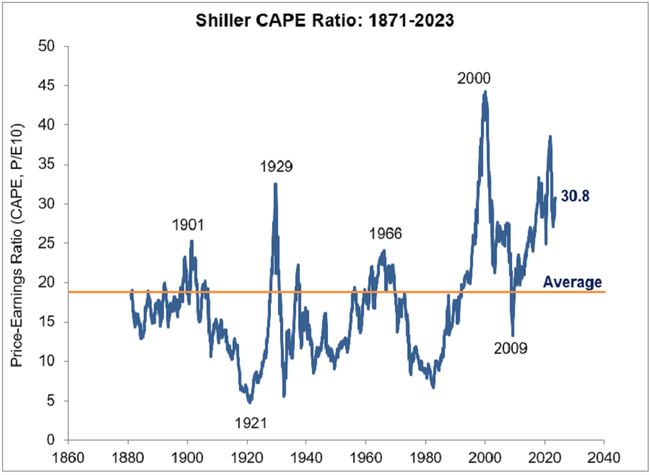
The Shiller cyclically adjusted P/E ratio (CAPE) for the US S&P 500 has averaged 17.4 over the period since 1871. It is hard to doubt the relevance of this figure given that it is over 150 years of data. Interestingly, over the horizon since 1990, the CAPE for the S&P 500 has been below its average value for only 22 months, about five percent of the time. The first time it was below average was 12 months in 1990 and 1991 and the second time was 10 months in 2008 and 2009. In neither case, however, were the values far below the historical average.

"If anyone was waiting for a buy signal sent by CAPE, they had only two opportunities in the past three decades and three years. And anyone who followed CAPE exclusively would not have bought anything in the U.S. stock markets since 2009," says Ben Carlson of investment firm Ritholtz Wealth Management.
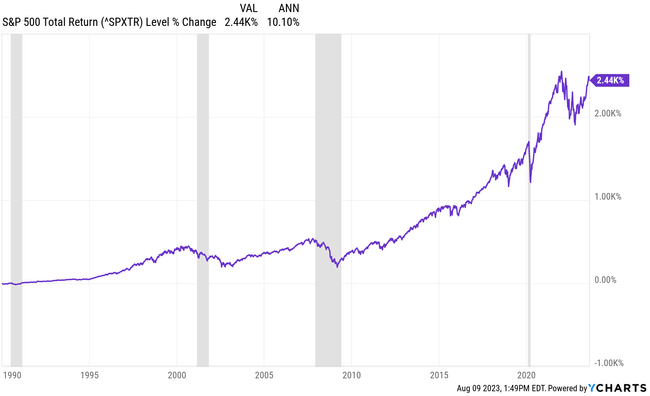
He points out that, according to valuation multiples, US stocks have been overvalued 95% of the time since 1995. Yet the S&P 500 has grown at an average annual rate of about 10% over that time frame. For good measure, let's add that between 2010 and 2020, US equities appreciated at an average annual rate of 14% and are now adding an average of 11% annually since 2020.

"I'm not naive, I know how long-term averages work, i.e. we are in for worse times. But I want to say that maybe we pay too much attention to valuation indicators. The data shows that US stocks are overvalued, but they continue to strengthen. Sure, you can sell your stock positions with reference to CAPE and other indicators and wait for the market to correct to buy at better prices, but you could easily lose another ten years or more of growth because of it," says Ben Carlson. "I'm not saying that valuation multiples are useless and don't work, but they are much more important from my perspective in individual stocks than from the overall market."

I have a similar opinion to Philip. You have to look at the individual sectors. Since tech stocks have been rising lately mainly because of AI. But other stocks from other sectors are either at average prices or some stocks are maybe even undervalued.
There it is rather good to focus on individual sectors/stock. For example, right now almost all of the growth is due to tech stocks in the US and the frenzy around AI. Yet a lot of good established companies in other sectors are hovering around that average. And then you have sectors where it's just always going to be specific (you can see it beautifully now with oil companies, for example)