These are the most accurate investment indicators and statistics that have worked flawlessly for decades

Navigating the stock market is not easy. But there are indicators, indicators and statistics that can suggest many things and give us some direction. Today, we'll look at three of them that have worked for many years.

These statistics have been around for decades
1) Longevity is the key
Predicting stock market movements is tricky. Or almost impossible. But there is one indicator that hasn't been wrong for more than a century. That's because it's easy to get swept up in short-term market swings. But these are not nearly as important as its long-term potential. Examining the total return of the S&P 500 Index since 1900 is extremely interesting. Analysts examined 104 years of data, from 1919 to 2022, to see which of those 20-year periods saw positive total returns.
They found that no matter what was happening in the stock market during these periods, the S&P 500 index achieved positive 20-year total returns 100% of the time. In other words, at any time after 1900, you could invest in an S&P 500 index fund, and if you held it for 20 years, you achieved positive total returns.
In the last two decades, we've had some of the worst downturns in history - from the dot-com crash to the Great Recession to the COVID-19 crash and now the current downturn.
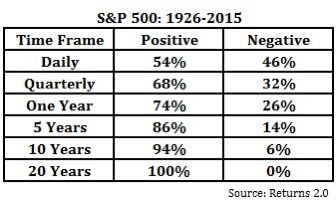
Despite all of this, however, the S&P 500 has remained in the black by more than 180% over that time. If you had invested in an S&P 500 index fund in January 2000, your investment would not only have survived, but you would have nearly tripled your money to date.
As the table above shows - even holding for 10 years, the chance of a positive outcome is 94%. With less time, the chance decreases.
2) The shorters are right
It's interesting but it turns out that shorters are more often right than wrong.
This comes from research by Matthew Ringgenberg, a professor of finance at the University of Utah and one of the leading academic experts on interpreting the behavior of shorters.
In his seminal study on the subject, he said that when interpreted correctly, the short ratio is "probably the strongest known indicator of total stock returns" over the next 12 months, beating any of a number of popular indicators used to predict returns - such as price-to-earnings or price-to-book value ratios.
But it is the correct interpretation that is important. The latter relates to Ringgenberg's observation that raw data on shorts becomes a better predictor when it expresses where the short ratio is relative to its underlying trend. The raw ratio represents the number of shorts as a percentage of the total number of shares outstanding.
3) Golden cross
This is going to be something for @krystofjane. Because we're going to go into a bit of technical analysis.
Many investors have probably heard of the "golden cross". This is a technical pattern that occurs when the short-term moving average crosses the long-term moving average. So there are many variations. It occurs when the moving average of a shorter period (typically 50 trading days) crosses the upward moving average of a longer period (typically 200 trading days).
This crossing signals an investment opportunity and the potential for further price growth. It is particularly applicable on price charts of stocks, futures contracts and forex.
It indicates an intensification of price growth momentum. If the crossing is followed by rapid price growth, it may indicate that a strong new trend is emerging. It is used together with other indicators. Better results are achieved if the golden cross is confirmed by other technical signals such as price supports and resistances, trend channels, etc.
Conversely, the "dead cross" concept signals a change in trend to the downside and indicates a selling opportunity. The short-term MA starts to decline. In technical analysis, this is one of the most well-known and commonly interpreted trend reversal signals.
There is another kind of golden cross, which is called a super golden cross.
Like the standard golden cross, this indicator appears when the 50-day moving average crosses the 200-day moving average. However, the super golden cross will only occur when the 50-day moving average remains above the 200-day moving average for at least three days. The shorter moving average must also spend at least nine months below the longer-term moving average.
Interestingly, since 1950 he has been 100% accurate in predicting the start of a new bull market for the S&P 500 index. After the super cross was broken, the index averaged up to 24% higher over the next 12 months.
What is your favorite indicator or statistic?
Disclaimer: This is in no way an investment recommendation. It is purely my summary and analysis based on data from the internet and other sources. Investing in the financial markets is risky and everyone should invest based on their own decisions. I am just an amateur sharing my opinions.