A week in the markets according to stock charts: US stocks recoup some of August's losses, S&P 500 index adds nearly a percent.
The streak of red weekly candles was broken, the S&P 500 index rose 0.82% for the week.
S&P 500
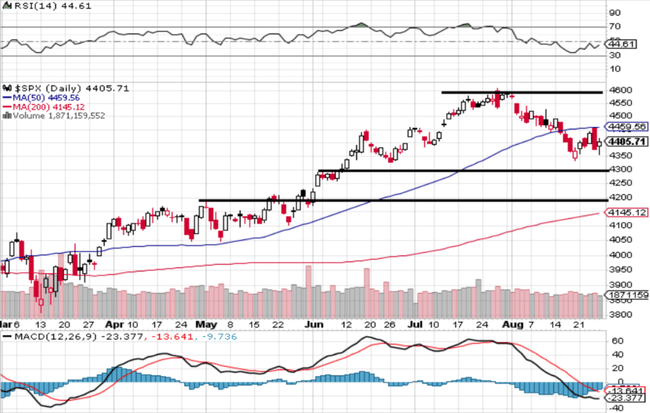
The S&P 500 index started the past week on an optimistic streak, which collapsed on Thursday when the index wrote off well over a percent. Thus, the green weekly candle was secured only at the end of Friday's trading session.
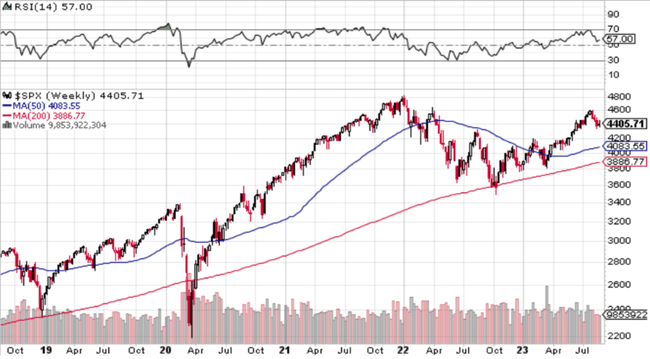
The daily and weekly charts remained virtually unchanged from the previous week. The S&P 500 index is below 4,500, where the nearest resistance is. The index approached it on Wednesday, but did not get any higher. On the flip side, important supports are in the 4,300 to 4,200 range. The index approached them on Monday and Friday, but that was all for now. A break of these would be a negative signal.

VIX
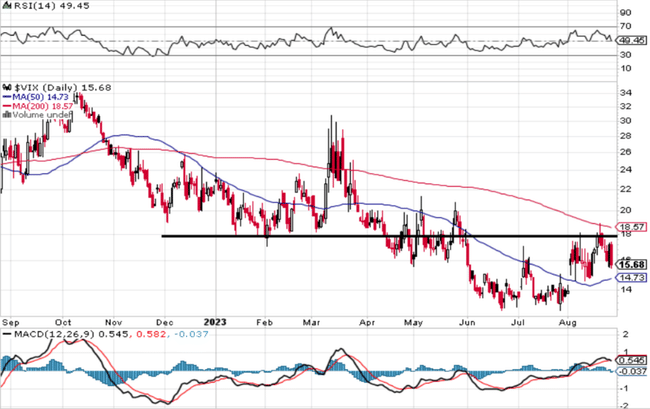
The VIX volatility index is below 18 points. It is thus in a neutral range, no shot higher has occurred yet.

Conclusion
The S&P 500 index is between its 50- and 200-day moving averages and its chart is in a neutral setting. Declines have always stopped above 4,300 so far. Especially on the weekly chart, there is no big drop yet.
The strong stock price gains of the previous 11 years or so, coupled with the quick turnaround after the March 2020 decline, have set perhaps unhealthily optimistic investor expectations. This August is a reminder that markets know both ways, confirming the historical seasonal pattern. Yet September need not be dull either.

We are currently experiencing the biggest index correction of the year. But the summer months are exceptional for that. because most people are on vacation and the markets are either slowly selling off or resting. I think we could return to a spring setup in the fall.
Fall could be a bit of a pump up again, big bucks will come back from "summer mode".
The holidays are over, so we'll see. One more red September and we can go up. 😇