


Watch Out: These 3 ETF Funds Are the Most Expensive on the Market

Thematic and dividend ETFs often charge more than 0.6% a year, roughly twenty times more than the cheapest index funds. The higher fee is deducted from the fund’s assets every day, regardless of performance. Data from the past ten years show that investors recoup it only rarely, and that a high dividend yield does not mean a high total return.
Key points
The expense ratios of thematic and dividend ETFs, around 0.6% to 0.7%, are well above the average for equity index funds, which was 0.14% in 2025.
An investor who puts in 10 000 USD and then adds 200 USD a month will have roughly 40 700 USD less after 30 years with an expense ratio of 0.70% than with 0.05%. The difference is almost half of all the money invested.
A higher fee raises the bar a fund has to clear every year. Over the past ten years, only some of the more expensive thematic funds cleared it, and even those often failed to beat a low-cost fund covering the entire sector.
A narrowly focused fund may not offer the broad exposure its name promises. The five largest holdings can make up more than 40% of the portfolio, leaving results dependent on just a few companies and their valuations.
A dividend yield of around 10% a year does not necessarily mean a profit. If the share price falls and distributions include a return of capital, the total return over ten years can end up in negative territory.
An ETF’s expense ratio is one of the few investment parameters investors know in advance and that will certainly affect their results. While market returns change every day, the fee is continuously deducted from the fund’s assets in good years and bad. Thematic and dividend funds cost many times more than broad index ETFs. Three funds from Global X and First Trust represent three different reasons investors pay a higher price: a bet on robotics and artificial intelligence, on cybersecurity, and on a high regular income. The key question is whether the funds have delivered enough in returns to make up for their higher costs.
Why ETF fees matter
Expense Ratio and Management Fee
The Expense Ratio, or total annual expense ratio (TER), shows what percentage of a fund’s assets is consumed by operating expenses each year. Investors never pay it as a bill. The fund deducts it continuously from its own assets, resulting in a lower net asset value (NAV) and therefore a lower share price. The return investors see in a fund’s performance history is already net of fees.
The Management Fee is the fee paid to the fund manager for managing the fund. For all three funds covered here, it makes up practically the entire expense ratio, because the managers use a so-called unitary fee that also covers custody, administration, and the index license:
$BOTZ: management fee 0,68 %, other expenses 0,00 %, total 0,68 %.
$SDIV: management fee 0,58 %, other expenses 0,00 %, total 0,58 %.
$CIBR: contractual management fee of 0,60 %, which is reduced once the fund reaches a certain size (so-called breakpoints). The current TER is 0,58 %.
Costs not included in the TER
The expense ratio does not include transaction costs within the fund. These increase with portfolio turnover, which was 68,09 % for SDIV in the last fiscal year, compared with just 12,11 % for BOTZ. The bid-ask spread on the exchange and withholding taxes on dividends from foreign companies are also excluded from the TER; these are significant for a global dividend fund. SDIV’s actual costs are therefore probably higher than the 0,58 % figure alone suggests.
Hypothetical investor: 10 000 USD and 200 USD a month
This hypothetical example assumes a one-time investment of 10 000 USD, followed by regular monthly contributions of 200 USD, and a gross portfolio return of 7% per year before fees. The fee is deducted monthly from the asset value; taxes and transaction costs are not included in the model. This is a purely illustrative calculation, not the historical performance of any particular fund.
Time horizon | Total invested | Value at TER of 0,05 % | Value at TER of 0,70 % | Difference |
|---|---|---|---|---|
10 years | 34 000 USD | 53 690 USD | 51 270 USD | 2 420 USD |
20 years | 58 000 USD | 139 210 USD | 126 980 USD | 12 230 USD |
30 years | 82 000 USD | 306 590 USD | 265 870 USD | 40 710 USD |
A difference of 0,65 percentage points a year seems negligible. But after thirty years, it amounts to almost half of all the money invested, because the higher fee reduces not only contributions but also all the future returns that the saved money would have earned.
Global X Robotics & AI ETF
Strategy and stock selection
Global X Robotics & Artificial Intelligence ETF was launched in September 2016 and passively tracks the Indxx Global Robotics & Artificial Intelligence Thematic Index. According to the April 2026 prospectus, it selects companies from developed markets and China with a market capitalization of at least 300 million USD and an average daily trading volume of at least 2 million USD.
A company qualifies for the index if it generates at least 50% of its revenue from one of five themes, or if its business in these areas is listed as its primary business activity:
industrial robotics and automation,
unmanned vehicles and drones,
non-industrial robotics (for example, surgical robots),
humanoid technologies,
artificial intelligence.
The index also allows up to 10 “diversified” companies with less than 50% of revenue from these themes, as well as companies with no revenue. Weights are based on market capitalization, subject to caps: 8% per company, 2% per diversified company with a total cap of 10%, and the same 10% aggregate cap for Chinese companies. The index is rebalanced semiannually. Its methodology was last changed on March 13, 2026, when humanoid technologies were added as a theme.
Portfolio composition
The methodology change significantly expanded the portfolio. While the fund held 49 stocks in March 2025, it held around 80 in October 2026. Smaller positions in Tesla, Alphabet, lidar manufacturers, and Chinese autonomous-driving companies were added as well. At the end of October 2026, the fund managed approximately 3,1 billion USD in assets.
Largest holdings at the end of October 2026:
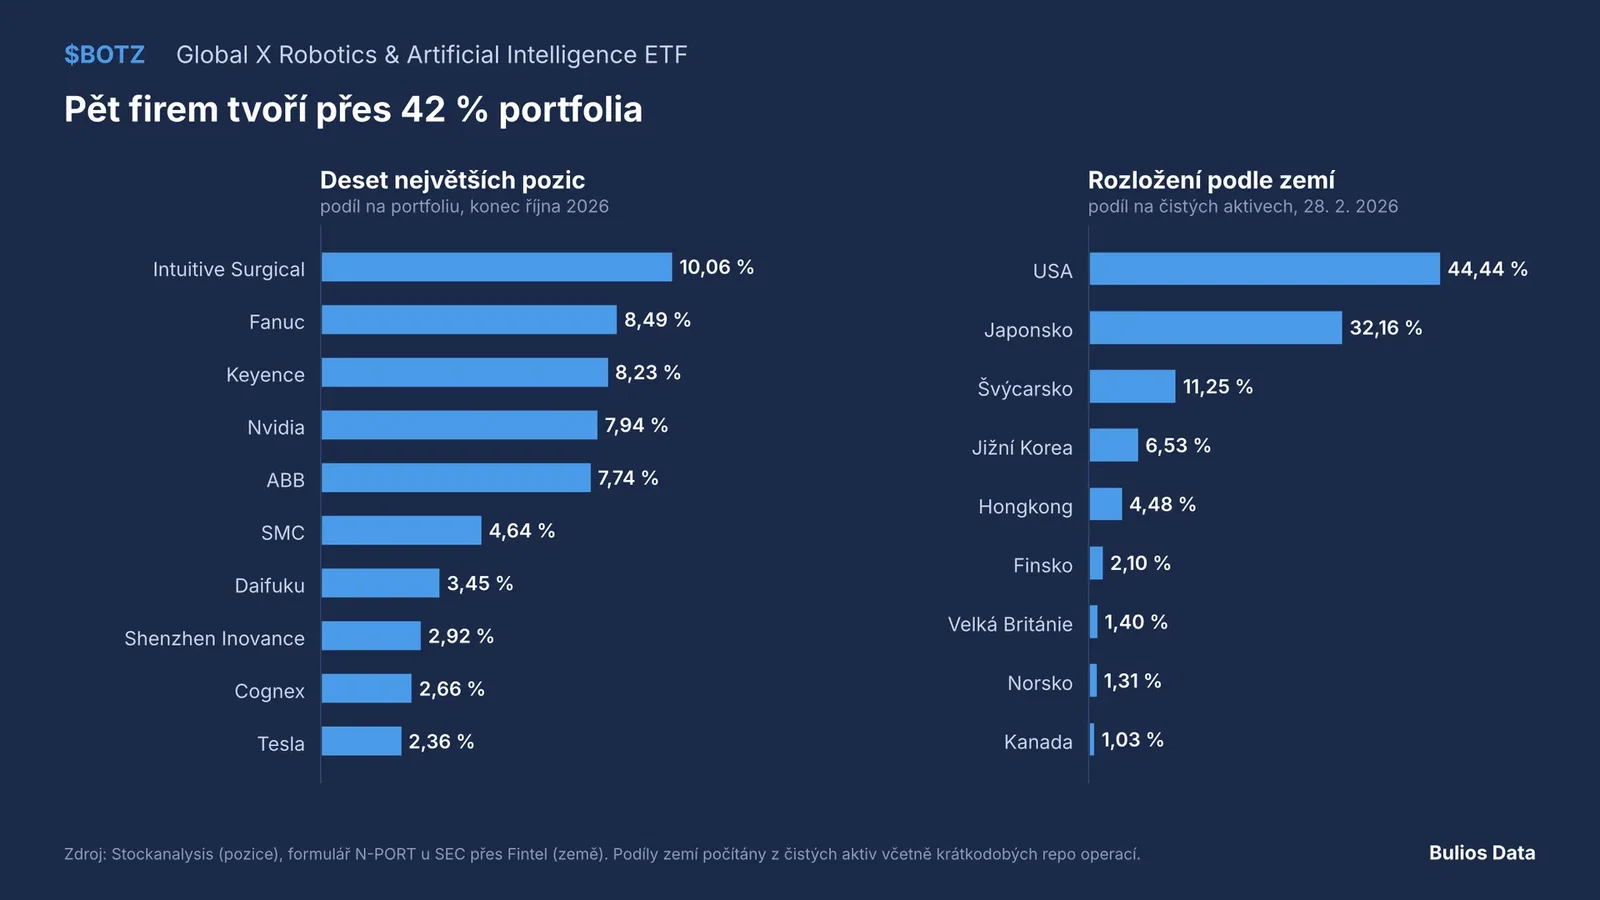
Intuitive Surgical $ISRG 10,06 %
Fanuc $FANUY 8,49 %
Keyence $KYCCF 8,23 %
Nvidia $NVDA 7,94 %
ABB $ABBNY 7,74 %
SMC $6273.T 4,64 %
Daifuku $6383.T 3,45 %
According to an SEC filing dated 28. 2. 2026, 44,4 % of assets were allocated to the U.S., 32,2 % to Japan, 11,3 % to Switzerland, and 6,5 % to South Korea. By sector, industrials accounted for 47,8 %, technology for 33,3 %, and healthcare for 9,9 %.
Concentration and valuation
As of 30. 10. 2026, the ten largest holdings made up 58,7 % of the portfolio, and the five largest accounted for more than 42 %. Intuitive Surgical, with a weight of around 10%, exceeds the index cap of 8% because weights can rise freely with share prices between semiannual rebalances. The fund’s performance is therefore largely determined by five companies: a surgical robot maker, three Japanese automation-equipment manufacturers, and Nvidia. The broad exposure to robotics promised by the name is therefore more of a concentrated bet on a few leaders.
Valuations are high. As of 30. 10. 2026, Global X reported a price-to-earnings (P/E) ratio of 42,96 based on 2025 earnings and 29,83 based on estimated 2026 earnings. The global MSCI ACWI index $ACWI traded at a P/E of 24,60 on the same date. The difference between BOTZ’s two figures means the market is counting on portfolio companies’ earnings rising by more than 40% in a single year. If estimates are not met, the high multiple has little to support it.